

Proteomic survey of metabolic pathways in rice
- PMID: 12163647
- PMCID: PMC129378
- DOI: 10.1073/pnas.172183199
Proteomic survey of metabolic pathways in rice
Abstract
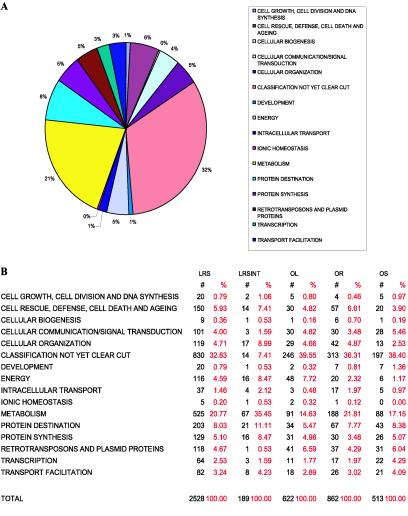
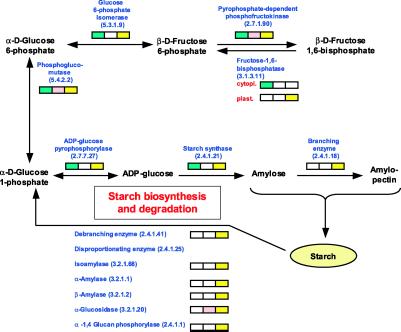
A systematic proteomic analysis of rice (Oryza sativa) leaf, root, and seed tissue using two independent technologies, two-dimensional gel electrophoresis followed by tandem mass spectrometry and multidimensional protein identification technology, allowed the detection and identification of 2,528 unique proteins, which represents the most comprehensive proteome exploration to date. A comparative display of the expression patterns indicated that enzymes involved in central metabolic pathways are present in all tissues, whereas metabolic specialization is reflected in the occurrence of a tissue-specific enzyme complement. For example, tissue-specific and subcellular compartment-specific isoforms of ADP-glucose pyrophosphorylase were detected, thus providing proteomic confirmation of the presence of distinct regulatory mechanisms involved in the biosynthesis and breakdown of separate starch pools in different tissues. In addition, several previously characterized allergenic proteins were identified in the seed sample, indicating the potential of proteomic approaches to survey food samples with regard to the occurrence of allergens.
Figures
Comment in
-
Plant proteomics: BLASTing out of a MudPIT.Proc Natl Acad Sci U S A. 2002 Sep 3;99(18):11564-6. doi: 10.1073/pnas.192449199. Epub 2002 Aug 23. Proc Natl Acad Sci U S A. 2002. PMID: 12195024 Free PMC article. No abstract available.
Similar articles
-
Mapping and comparative proteomic analysis of the starch biosynthetic pathway in rice by 2D PAGE/MS.Plant Mol Biol. 2017 Nov;95(4-5):333-343. doi: 10.1007/s11103-017-0652-2. Epub 2017 Sep 8. Plant Mol Biol. 2017. PMID: 28887709
-
High-throughput functional affinity purification of mannose binding proteins from Oryza sativa.Proteomics. 2003 Jul;3(7):1270-8. doi: 10.1002/pmic.200300447. Proteomics. 2003. PMID: 12872227
-
Towards an analysis of the rice mitochondrial proteome.Plant Physiol. 2003 May;132(1):230-42. doi: 10.1104/pp.102.018986. Plant Physiol. 2003. PMID: 12746528 Free PMC article.
-
Plant proteome analysis: a 2004-2006 update.Proteomics. 2006 Oct;6(20):5529-48. doi: 10.1002/pmic.200600260. Proteomics. 2006. PMID: 16991197 Review.
-
Proteomic studies in plants.J Biochem Mol Biol. 2004 Jan 31;37(1):133-8. doi: 10.5483/bmbrep.2004.37.1.133. J Biochem Mol Biol. 2004. PMID: 14761311 Review.
Cited by
-
Update on plant ionomics.Plant Physiol. 2004 Sep;136(1):2451-6. doi: 10.1104/pp.104.047753. Plant Physiol. 2004. PMID: 15375201 Free PMC article. Review. No abstract available.
-
Rice Proteome Database based on two-dimensional polyacrylamide gel electrophoresis: its status in 2003.Nucleic Acids Res. 2004 Jan 1;32(Database issue):D388-92. doi: 10.1093/nar/gkh020. Nucleic Acids Res. 2004. PMID: 14681440 Free PMC article.
-
Proteome-wide characterization of sugarbeet seed vigor and its tissue specific expression.Proc Natl Acad Sci U S A. 2008 Jul 22;105(29):10262-7. doi: 10.1073/pnas.0800585105. Epub 2008 Jul 17. Proc Natl Acad Sci U S A. 2008. PMID: 18635686 Free PMC article.
-
Understanding Omics Driven Plant Improvement and de novo Crop Domestication: Some Examples.Front Genet. 2021 Apr 6;12:637141. doi: 10.3389/fgene.2021.637141. eCollection 2021. Front Genet. 2021. PMID: 33889179 Free PMC article. Review.
-
Proteome reference maps of vegetative tissues in pea. An investigation of nitrogen mobilization from leaves during seed filling.Plant Physiol. 2004 Aug;135(4):2241-60. doi: 10.1104/pp.104.041947. Epub 2004 Aug 6. Plant Physiol. 2004. PMID: 15299134 Free PMC article.
References
MeSH terms
Substances
LinkOut - more resources
Full Text Sources
Other Literature Sources
