. 2002 Aug 5;196(3):379-87.
doi: 10.1084/jem.20020110.

Phenotype, localization, and mechanism of suppression of CD4(+)CD25(+) human thymocytes

Affiliations

Phenotype, localization, and mechanism of suppression of CD4(+)CD25(+) human thymocytes

Francesco Annunziato et al. J Exp Med. .

Abstract

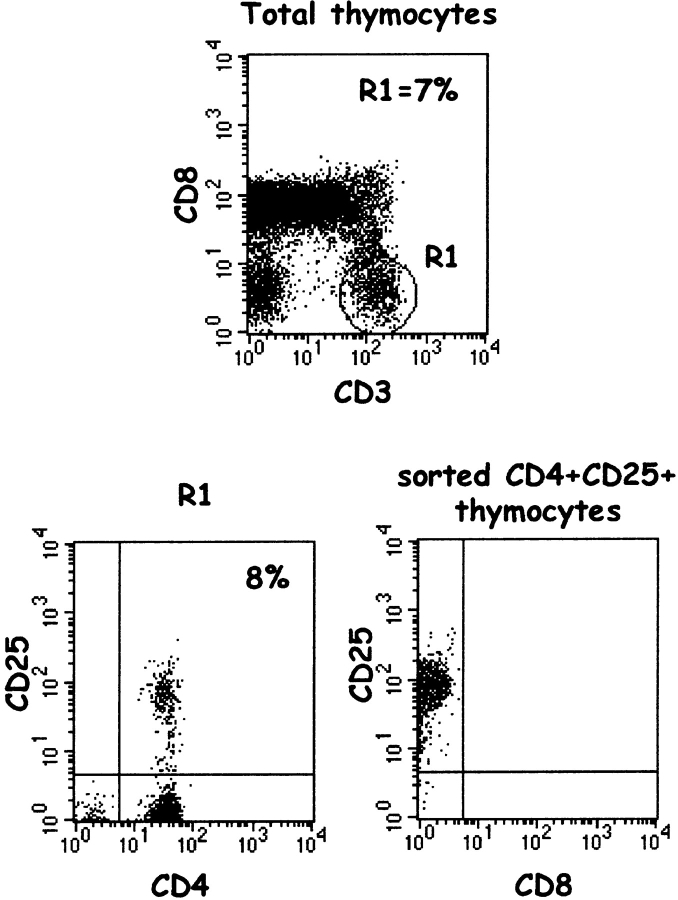
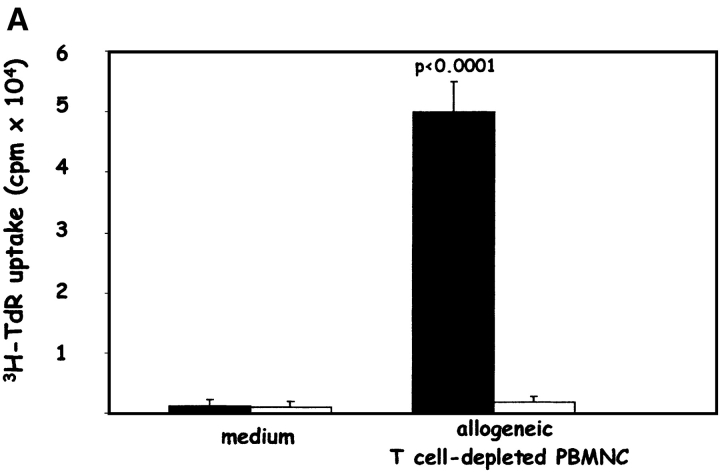
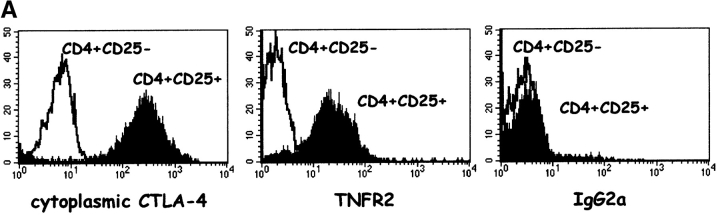
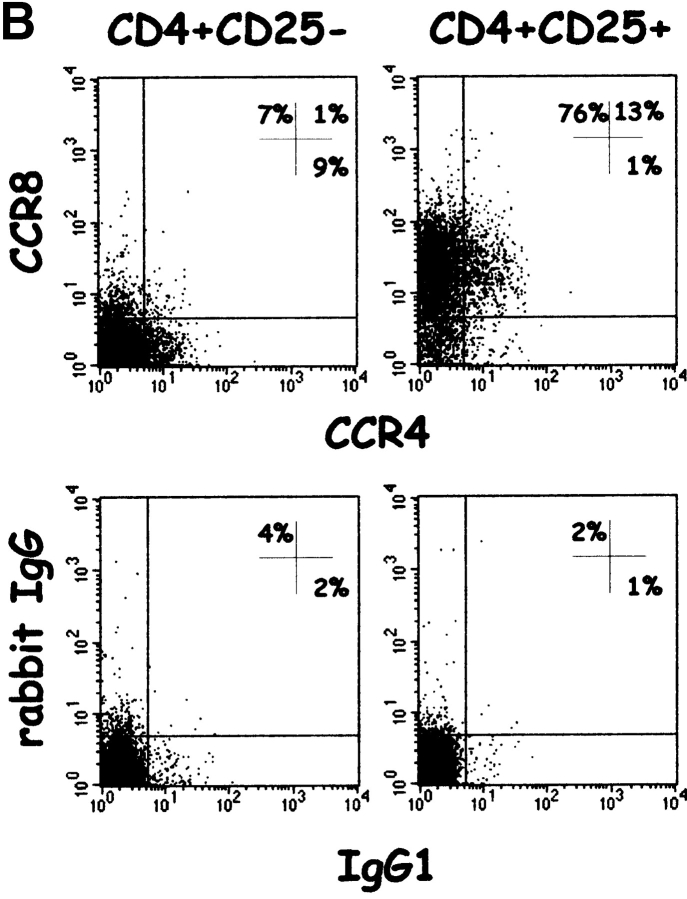
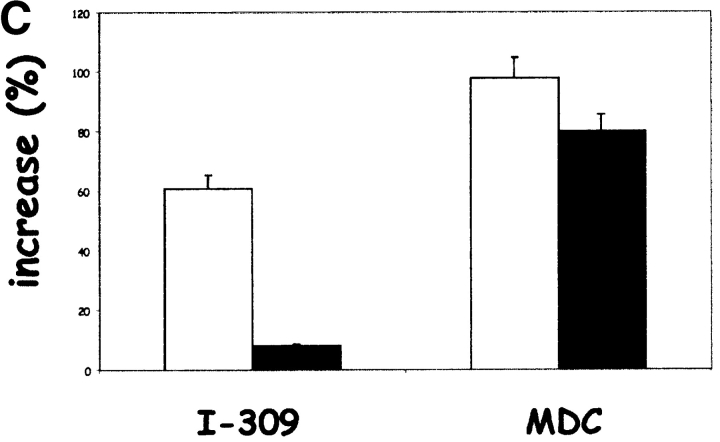
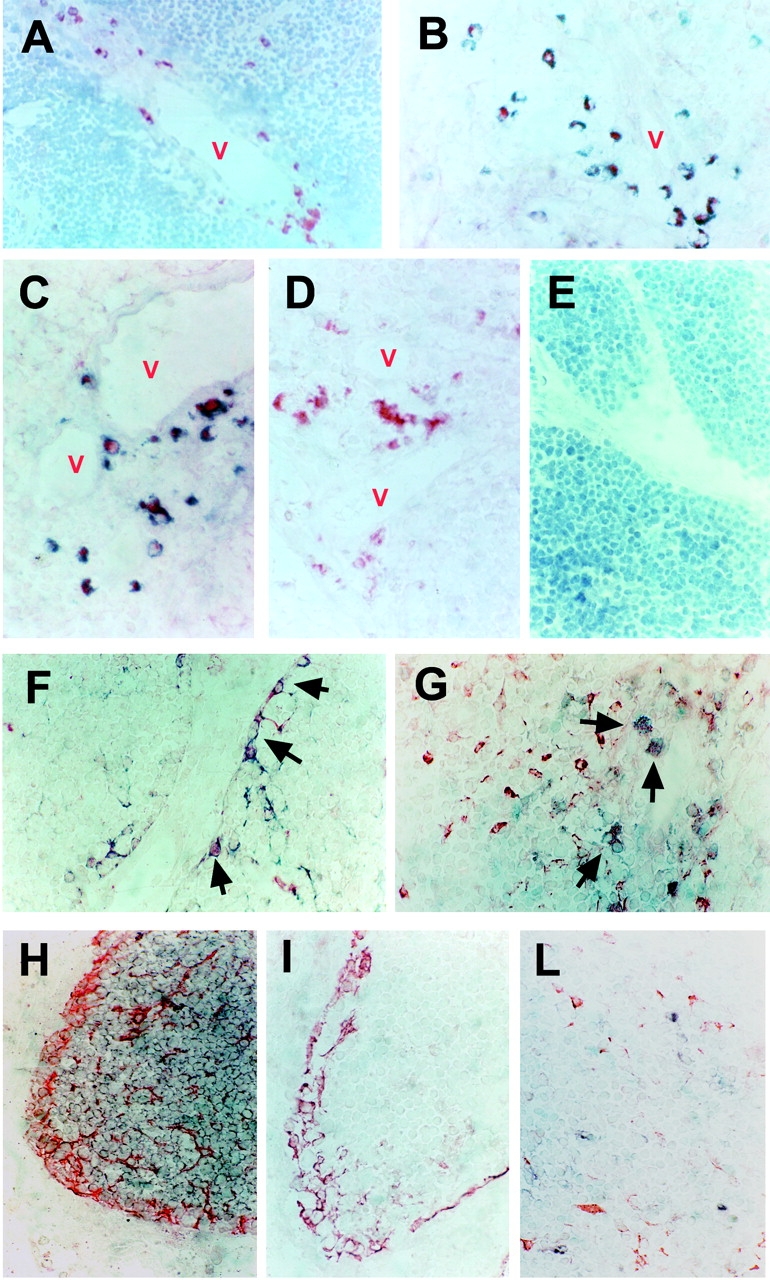
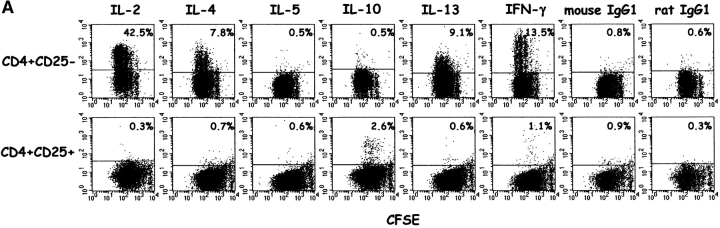
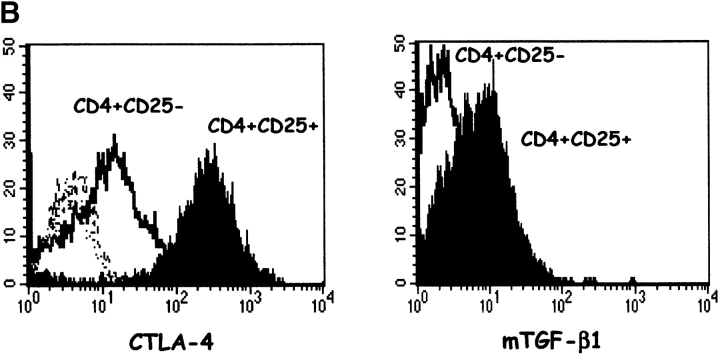
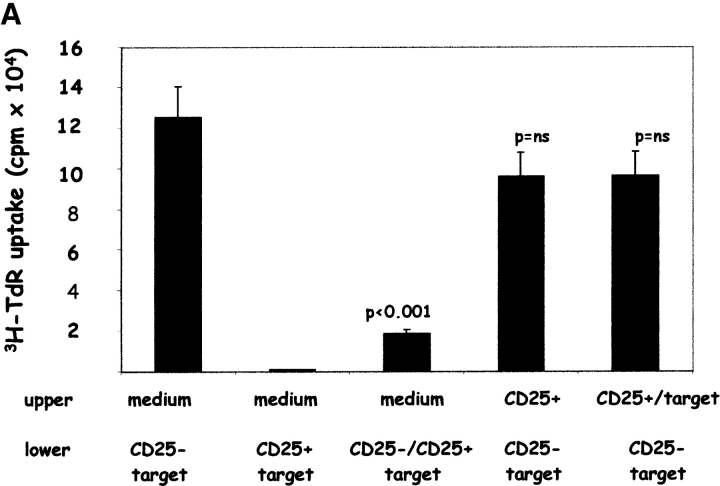
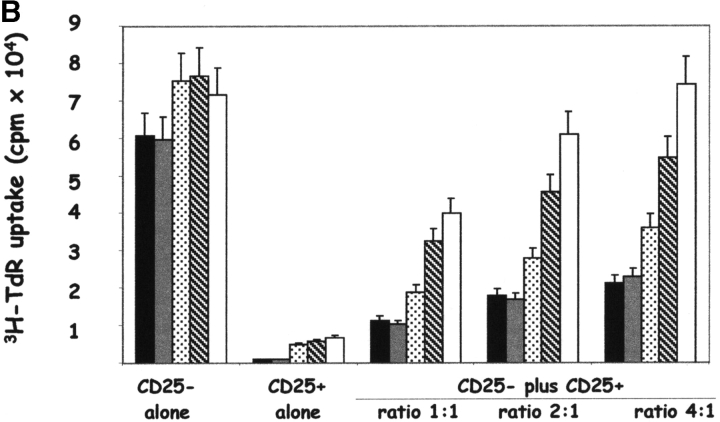
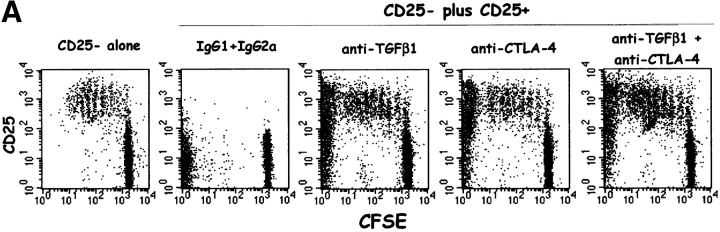
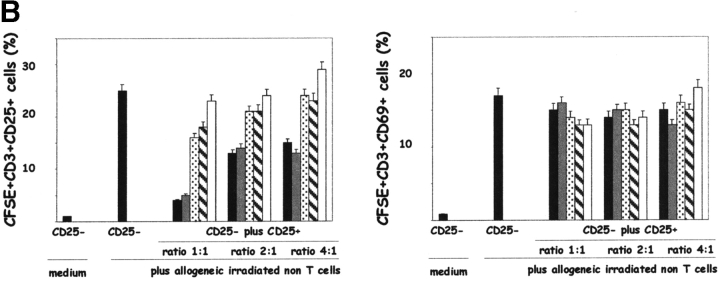
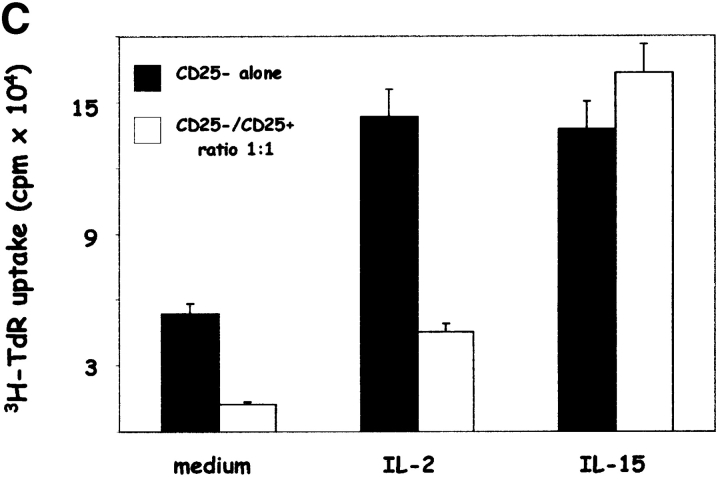
Phenotypic markers, localization, functional activities, and mechanisms of action in vitro of CD4(+)CD25(+) T cells, purified from postnatal human thymuses, were investigated. These cells showed poor or no proliferation in mixed lymphocyte culture (MLC), and suppressed in a dose-dependent fashion the proliferative response to allogeneic stimulation of CD4(+)CD25(-) thymocytes. Virtually all CD4(+)CD25(+) thymocytes constitutively expressed cytoplasmic T lymphocyte antigen (CTLA)-4, surface tumor necrosis factor type 2 receptor (TNFR2), and CCR8. They prevalently localized to perivascular areas of fibrous septa and responded to the chemoattractant activity of CCL1/I-309, which was found to be produced by either thymic medullary macrophages or fibrous septa epithelial cells. After polyclonal activation, CD4(+)CD25(+) thymocytes did not produce the cytokines interleukin (IL)-2, IL-4, IL-5, IL-13, interferon gamma, and only a very few produced IL-10, but all they expressed on their surface CTLA-4 and the majority of them also transforming growth factor (TGF)-beta1. The suppressive activity of these cells was contact dependent and associated with the lack of IL-2 receptor (IL-2R) alpha-chain (CD25) expression in target cells. Such a suppressive activity was partially inhibited by either anti-CTLA-4 or anti-TGF-beta1, and was completely blocked by a mixture of these monoclonal antibodies, which were also able to restore in target T cells the expression of IL-2R alpha-chain and, therefore, their responsiveness to IL-2. These data demonstrate that CD4(+)CD25(+) human thymocytes represent a population of regulatory cells that migrate in response to the chemokine CCL1/I-309 and exert their suppressive function via the inhibition of IL-2R alpha-chain in target T cells, induced by the combined activity of CTLA-4 and membrane TGF-beta1.


Figures

Figure 1.
Figure 1.
Identification and purification of CD4+CD25+ human thymocytes. Freshly isolated human thymocytes were assessed for the expression of CD3, CD4, CD8, and CD25 by flow cytometry. After MACS® sorting, purified CD4+CD25+ thymocytes were assessed for CD8 and CD25 expression. One representative experiment is shown.
Figure 2.
Figure 2.
CD4+CD25+ human thymocytes do not proliferate in MLC and suppress the proliferation in MLC of CD4+CD25 thymocytes. (A) Proliferative response of purified CD4+CD25+ (white columns) and CD4+CD25 (black columns) human thymocytes to allogeneic stimulation. Mean values (±SD) obtained in six separate experiments are reported. (B) Suppression by CD4+CD25+ thymocytes of the proliferative response of autologous CD4+CD25 thymocytes to allogeneic T cell–depleted PBMNCs. Mean values (±SD) obtained in six separate experiments are reported.
Figure 2.
Figure 2.
CD4+CD25+ human thymocytes do not proliferate in MLC and suppress the proliferation in MLC of CD4+CD25 thymocytes. (A) Proliferative response of purified CD4+CD25+ (white columns) and CD4+CD25 (black columns) human thymocytes to allogeneic stimulation. Mean values (±SD) obtained in six separate experiments are reported. (B) Suppression by CD4+CD25+ thymocytes of the proliferative response of autologous CD4+CD25 thymocytes to allogeneic T cell–depleted PBMNCs. Mean values (±SD) obtained in six separate experiments are reported.
Figure 3.
Figure 3.
All CD4+CD25+ human thymocytes constitutively express cytoplasmic CTLA-4 and surface TNFR2, CCR8 and exhibit chemotactic response to CCL1/I-309. (A) Freshly purified CD4+CD25+ and CD4+CD25 thymocytes were assessed for the expression of cytoplasmic CTLA-4 and surface TNFR2 by flow cytometry. The cytofluorimetric picture obtained with IgG2a isotype control is also depicted. One representative of four experiments is shown. (B) Expression of CCR4 and CCR8 on the surface of CD4+CD25 or CD4+CD25+ thymocytes. The cytofluorimetric picture obtained with IgG1 and rabbit IgG isotype controls is also depicted. One representative of four experiments is shown. (C) Chemotactic response of CD4+CD25+ and CD4+CD25 thymocytes to CCL1/I-309 or CCL22/MDC. Cell migration of CD4+CD25+ (white columns) or CD4+CD25 (black columns) thymocytes was evaluated by counting migrated cells with BD-LSR cytometer. Values are expressed as percentage increase of cells migrated in response to CCL1/I-309 or CCL22/MDC versus cells migrated in the presence of medium alone (32.3 ± 1.7 × 10³). Mean values (±SD) obtained in three separate experiments are reported.
Figure 3.
Figure 3.
All CD4+CD25+ human thymocytes constitutively express cytoplasmic CTLA-4 and surface TNFR2, CCR8 and exhibit chemotactic response to CCL1/I-309. (A) Freshly purified CD4+CD25+ and CD4+CD25 thymocytes were assessed for the expression of cytoplasmic CTLA-4 and surface TNFR2 by flow cytometry. The cytofluorimetric picture obtained with IgG2a isotype control is also depicted. One representative of four experiments is shown. (B) Expression of CCR4 and CCR8 on the surface of CD4+CD25 or CD4+CD25+ thymocytes. The cytofluorimetric picture obtained with IgG1 and rabbit IgG isotype controls is also depicted. One representative of four experiments is shown. (C) Chemotactic response of CD4+CD25+ and CD4+CD25 thymocytes to CCL1/I-309 or CCL22/MDC. Cell migration of CD4+CD25+ (white columns) or CD4+CD25 (black columns) thymocytes was evaluated by counting migrated cells with BD-LSR cytometer. Values are expressed as percentage increase of cells migrated in response to CCL1/I-309 or CCL22/MDC versus cells migrated in the presence of medium alone (32.3 ± 1.7 × 10³). Mean values (±SD) obtained in three separate experiments are reported.
Figure 4.
Figure 4.
Localization of CD4+CD25+ and of CCL1/I-309–expressing cells in human thymus. (A) Thymic sections stained with anti-CD25 mAb (red color) and counterstained with Gill's Hematoxylin (original magnification: ×250). (B) Double staining of the same thymus with anti-CD4 (bluish gray) and anti-CD25 (red color) mAb; no counterstain was applied (original magnification: ×400). (C) Double staining with anti-CD25 mAb (bluish gray) and anti-CCR8 polyclonal Ab (red color); no counterstain was applied (original magnification: ×400). (D) Double staining with anti-CCR8 polyclonal Ab (red color) and an isotype-matched mAb with irrelevant specificity (bluish gray); no counterstain was applied (original magnification: ×400). (E) Absence of staining in the same thymus using a rabbit polyclonal Ab with irrelevant specificity (original magnification: ×400). (F) Double staining with anti–CCL1/I-309 (red) and anti-CK (bluish gray) Abs. Arrows indicate cells showing double staining for CCL1/I-309 and CK; no counterstain was applied (original magnification: ×400). (G) Double staining with anti-CCL1/I-309 (red) and anti-CD68 (bluish gray). Arrows indicate cells showing double staining for CCL1/I-309 and CD68; no counterstain was applied (original magnification: ×400). (H) Double staining with anti–CCL1/I-309 (red) and anti-CD3 (bluish gray); no counterstain was applied (original magnification: ×400). (I) Double staining with anti–CCL1/I-309 polyclonal Ab (red color) and an isotype-matched mAb with irrelevant specificity (bluish gray); no counterstain was applied (original magnification: ×400). (L) Double staining with anti–CCL1/I-309 (red) and anti-CD83 (bluish gray); no counterstain was applied (original magnification: ×400). V, vessel.
Figure 5.
Figure 5.
Activated CD4+CD25+ human thymocytes do not produce cytokines, but express mTGF-β1 and CTLA-4. CFSE-labeled CD4+CD25+ or CD4+CD25 thymocytes were incubated with insolubilized anti-CD3 mAb plus soluble anti-CD28 mAb. (A) On day 6, cells were stimulated with PMA plus ionomycin and cytokine synthesis at single cell level was analyzed on a BD-LSR cytofluorimeter using CELLQuest™ software (Becton Dickinson). (B) Before PMA plus ionomycin stimulation, CD4+CD25+ and CD4+CD25 thymocytes were assessed for the expression of surface CTLA-4 and mTGF-31, by flow cytometry.
Figure 5.
Figure 5.
Activated CD4+CD25+ human thymocytes do not produce cytokines, but express mTGF-β1 and CTLA-4. CFSE-labeled CD4+CD25+ or CD4+CD25 thymocytes were incubated with insolubilized anti-CD3 mAb plus soluble anti-CD28 mAb. (A) On day 6, cells were stimulated with PMA plus ionomycin and cytokine synthesis at single cell level was analyzed on a BD-LSR cytofluorimeter using CELLQuest™ software (Becton Dickinson). (B) Before PMA plus ionomycin stimulation, CD4+CD25+ and CD4+CD25 thymocytes were assessed for the expression of surface CTLA-4 and mTGF-31, by flow cytometry.
Figure 6.
Figure 6.
Cell contact–dependent suppressive activity of CD4+CD25+ human thymocytes is abrogated by the combined action of anti–CTLA-4 and anti-TGFβ1 mAbs. (A) CD4+CD25 thymocytes were stimulated with irradiated T cell–depleted allogeneic PBMNCs in the lower chamber of a transwell plate in the absence or presence of CD4+CD25+ thymocytes, placed in the same or in the top chamber. On day 5, cells present in the bottom chamber were harvested and their proliferation assessed by measuring 3[H]TdR uptake. (B) CD4+CD25 thymocytes were stimulated with allogeneic irradiated T cell–depleted PBMNCs in the presence of different numbers of autologous purified CD4+CD25+ thymocytes without (black columns) or with isotype control (IgG1+IgG2a) (gray columns), anti-CTLA-4 (hatched columns), or anti–TGF-β1 mAb (dotted columns), or mixtures of them (white columns). Cell proliferation was measured by assessment of 3[H]TdR uptake. Mean values (±SD) obtained in four separate experiments are reported.
Figure 6.
Figure 6.
Cell contact–dependent suppressive activity of CD4+CD25+ human thymocytes is abrogated by the combined action of anti–CTLA-4 and anti-TGFβ1 mAbs. (A) CD4+CD25 thymocytes were stimulated with irradiated T cell–depleted allogeneic PBMNCs in the lower chamber of a transwell plate in the absence or presence of CD4+CD25+ thymocytes, placed in the same or in the top chamber. On day 5, cells present in the bottom chamber were harvested and their proliferation assessed by measuring 3[H]TdR uptake. (B) CD4+CD25 thymocytes were stimulated with allogeneic irradiated T cell–depleted PBMNCs in the presence of different numbers of autologous purified CD4+CD25+ thymocytes without (black columns) or with isotype control (IgG1+IgG2a) (gray columns), anti-CTLA-4 (hatched columns), or anti–TGF-β1 mAb (dotted columns), or mixtures of them (white columns). Cell proliferation was measured by assessment of 3[H]TdR uptake. Mean values (±SD) obtained in four separate experiments are reported.
Figure 7.
Figure 7.
CTLA-4 and TGF-β1–mediated suppression is due to the inhibition of IL-2R α-chain expression and is overcome by IL-15. (A) CFSE-labeled CD4+CD25 thymocytes were stimulated with irradiated allogeneic PB non-T cells in absence or presence of autologous CD4+CD25+ thymocytes with anti–CTLA-4, anti–TGF-β1, anti–CTLA-4 plus anti–TGF-β1 or isotype-matched (IgG1 plus IgG2a) mAbs, and assessed by flow cytometry for proliferation and surface CD25 expression. One representative of three separate experiments is shown. (B) CD25 (left) and CD69 (right) expression by CD4+CD25 thymocytes cultured under the experimental conditions mentioned in (A). CD4+CD25 thymocytes without mAb added (black columns), or containing isotype control (gray columns), anti–TGF-β1 (dotted columns), anti–CTLA-4 (hatched columns), or anti–CTLA-4 plus anti–TGF-β1 (white columns) mAbs. Columns represent mean values (±SD) found in three separate experiments. (C) Effect of the addition of exogenous IL-2 or IL-15 on the proliferative response of CD4+CD25 thymocytes stimulated with irradiated allogeneic non-T cells in absence or presence of CD4+CD25+ autologous thymocytes. Columns represent mean values (±SD) obtained in three separate experiments.
Figure 7.
Figure 7.
CTLA-4 and TGF-β1–mediated suppression is due to the inhibition of IL-2R α-chain expression and is overcome by IL-15. (A) CFSE-labeled CD4+CD25 thymocytes were stimulated with irradiated allogeneic PB non-T cells in absence or presence of autologous CD4+CD25+ thymocytes with anti–CTLA-4, anti–TGF-β1, anti–CTLA-4 plus anti–TGF-β1 or isotype-matched (IgG1 plus IgG2a) mAbs, and assessed by flow cytometry for proliferation and surface CD25 expression. One representative of three separate experiments is shown. (B) CD25 (left) and CD69 (right) expression by CD4+CD25 thymocytes cultured under the experimental conditions mentioned in (A). CD4+CD25 thymocytes without mAb added (black columns), or containing isotype control (gray columns), anti–TGF-β1 (dotted columns), anti–CTLA-4 (hatched columns), or anti–CTLA-4 plus anti–TGF-β1 (white columns) mAbs. Columns represent mean values (±SD) found in three separate experiments. (C) Effect of the addition of exogenous IL-2 or IL-15 on the proliferative response of CD4+CD25 thymocytes stimulated with irradiated allogeneic non-T cells in absence or presence of CD4+CD25+ autologous thymocytes. Columns represent mean values (±SD) obtained in three separate experiments.

Similar articles

Cited by

References

    1. Sakaguchi, S. 2000. Regulatory T cell: key controllers of immunologic self-tolerance. Cell. 101:455–458. - PubMed
    1. Asano, M., M. Toda, N. Sakaguchi, and S. Sakaguchi. 1996. Autoimmune disease as a consequence of developmental abnormality of a T cell population. J. Exp. Med. 184:387–396. - PMC - PubMed
    1. Shevach, E.M. 2000. Regulatory T cells in autoimmunity. Annu. Rev. Immunol. 18:423–449. - PubMed
    1. Suri-Payer, E., A.Z. Amar, R. McHugh, K. Natarajan, D.H. Margulies, and E.M. Shevach. 1999. Postéthymectomy autoimmune gastritis: fine specificity and pathogenicity of anti-H/K ATPase reactive T cells. Eur. J. Immunol. 29:669–677. - PubMed
    1. Read, S., V. Malmstrom, and F. Powrie. 2000. Cytotoxic T lymphocyte associated antigen 4 plays an essential role in the function of CD25+CD4+ regulatory cells that control intestinal inflammation. J. Exp. Med. 192:295–302. - PMC - PubMed

Publication types