

Adipose tissue mass can be regulated through the vasculature
- PMID: 12149466
- PMCID: PMC125027
- DOI: 10.1073/pnas.162349799
Adipose tissue mass can be regulated through the vasculature
Abstract
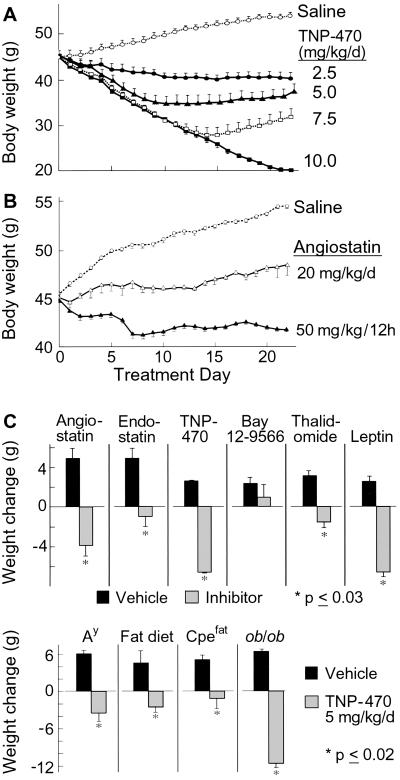
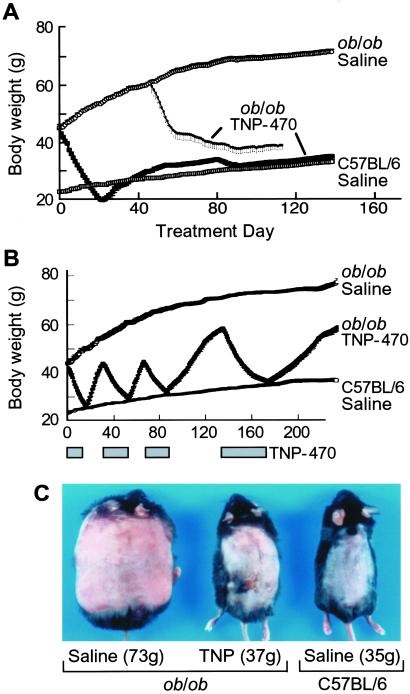
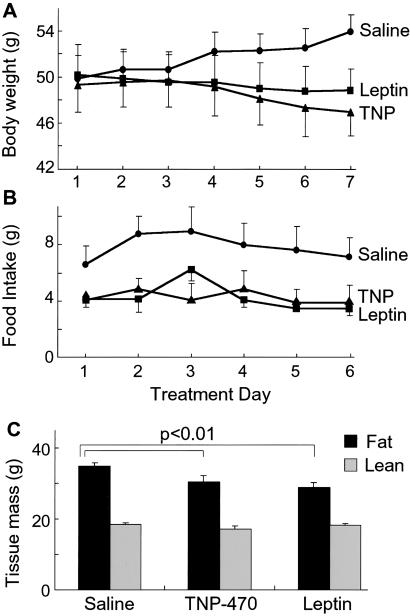
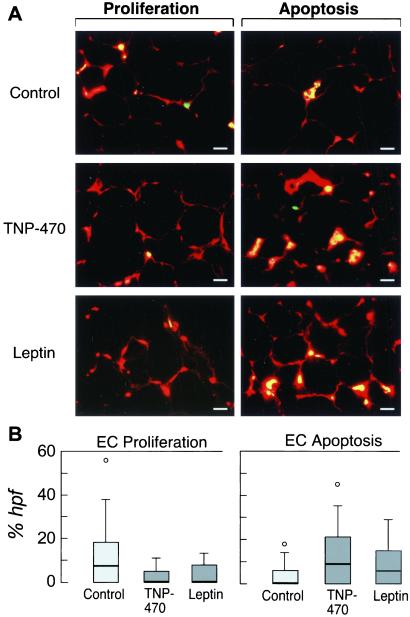
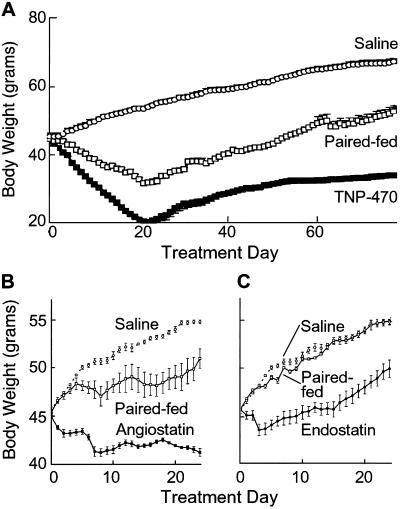
Tumor growth is angiogenesis dependent. We hypothesized that nonneoplastic tissue growth also depends on neovascularization. We chose adipose tissue as an experimental system because of its remodeling capacity. Mice from different obesity models received anti-angiogenic agents. Treatment resulted in dose-dependent, reversible weight reduction and adipose tissue loss. Marked vascular remodeling was evident in adipose tissue sections, which revealed decreased endothelial proliferation and increased apoptosis in treated mice compared with controls. Continuous treatment maintained mice near normal body weights for age without adverse effects. Metabolic adaptations in food intake, metabolic rate, and energy substrate utilization were associated with anti-angiogenic weight loss. We conclude that adipose tissue mass is sensitive to angiogenesis inhibitors and can be regulated by its vasculature.
Figures
Comment in
-
Treating obesity like a tumor.Cell Metab. 2012 Jan 4;15(1):1-2. doi: 10.1016/j.cmet.2011.12.007. Cell Metab. 2012. PMID: 22225867
Similar articles
-
Effects of angiogenesis inhibitors on multistage carcinogenesis in mice.Science. 1999 Apr 30;284(5415):808-12. doi: 10.1126/science.284.5415.808. Science. 1999. PMID: 10221914
-
Effect of antiangiogenic therapy on slowly growing, poorly vascularized tumors in mice.J Natl Cancer Inst. 2001 Mar 7;93(5):382-7. doi: 10.1093/jnci/93.5.382. J Natl Cancer Inst. 2001. PMID: 11238700
-
Anginex, a designed peptide that inhibits angiogenesis.Biochem J. 2001 Mar 1;354(Pt 2):233-42. doi: 10.1042/0264-6021:3540233. Biochem J. 2001. PMID: 11171099 Free PMC article.
-
Antiangiogenesis -- therapeutic strategies and clinical implications for brain tumors.J Neurooncol. 2000 Oct-Nov;50(1-2):189-200. doi: 10.1023/a:1006469830739. J Neurooncol. 2000. PMID: 11245279 Review.
-
General aspects of anti-angiogenesis and cancer therapy.Expert Opin Biol Ther. 2001 Mar;1(2):253-75. doi: 10.1517/14712598.1.2.253. Expert Opin Biol Ther. 2001. PMID: 11727534 Review.
Cited by
-
Therapeutic assessment of cytochrome C for the prevention of obesity through endothelial cell-targeted nanoparticulate system.Mol Ther. 2013 Mar;21(3):533-41. doi: 10.1038/mt.2012.256. Epub 2013 Jan 8. Mol Ther. 2013. PMID: 23295953 Free PMC article.
-
Ablation of 3-phosphoinositide-dependent protein kinase 1 (PDK1) in vascular endothelial cells enhances insulin sensitivity by reducing visceral fat and suppressing angiogenesis.Mol Endocrinol. 2012 Jan;26(1):95-109. doi: 10.1210/me.2010-0412. Epub 2011 Nov 22. Mol Endocrinol. 2012. PMID: 22108800 Free PMC article.
-
Tumor angiogenesis and anti-angiogenic therapy.Chin Med J (Engl). 2024 Sep 5;137(17):2043-2051. doi: 10.1097/CM9.0000000000003231. Epub 2024 Jul 25. Chin Med J (Engl). 2024. PMID: 39051171 Free PMC article. Review.
-
The Role of Adipokines in Tumor Progression and Its Association with Obesity.Biomedicines. 2024 Jan 3;12(1):97. doi: 10.3390/biomedicines12010097. Biomedicines. 2024. PMID: 38255203 Free PMC article. Review.
-
Epicardial Adipose Tissue Is Nonlinearly Related to Anthropometric Measures and Subcutaneous Adipose Tissue.Int J Endocrinol. 2015;2015:456293. doi: 10.1155/2015/456293. Epub 2015 Jun 1. Int J Endocrinol. 2015. PMID: 26124828 Free PMC article.
References
-
- Folkman J. (1997) in Cancer, eds. DeVita, V., Jr., Hellman, S. & Rosenberg, S. (Lippincott, Philadelphia), pp. 3075–3085.
-
- Rak J., Filmus, J. & Kerbel, R. (1996) Eur. J. Cancer 32, 2438-2450. - PubMed
-
- Boehm T., Folkman, J., Browder, T. & O'Reilly, M. S. (1997) Nature (London) 390, 404-407. - PubMed
-
- Folkman J. (1998) Endocrinology 139, 441-442. - PubMed
Publication types
MeSH terms
Substances
Grants and funding
LinkOut - more resources
Full Text Sources
Other Literature Sources
Medical
