

1,25-Dihydroxyvitamin D(3) is a negative endocrine regulator of the renin-angiotensin system
- PMID: 12122115
- PMCID: PMC151055
- DOI: 10.1172/JCI15219
1,25-Dihydroxyvitamin D(3) is a negative endocrine regulator of the renin-angiotensin system
Abstract
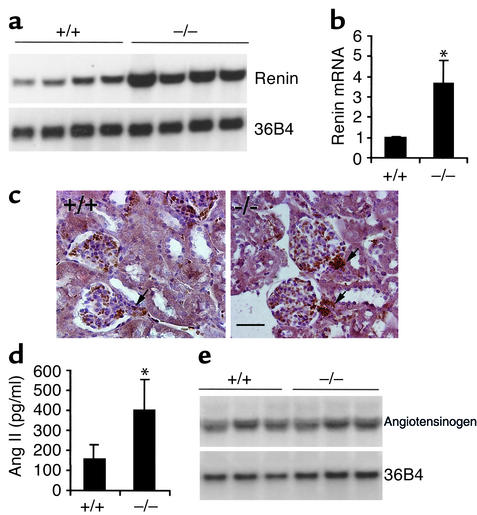
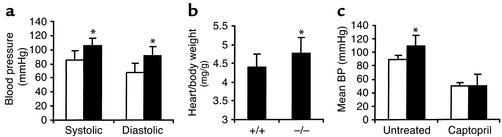
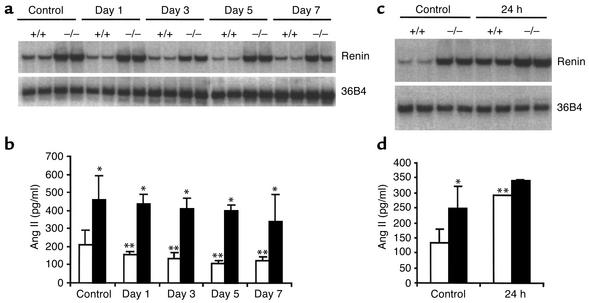
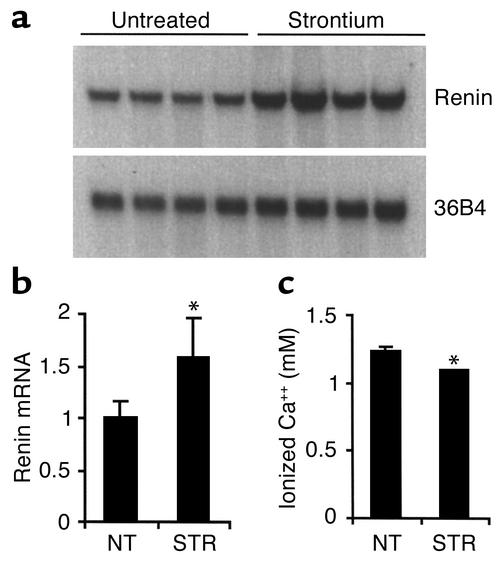
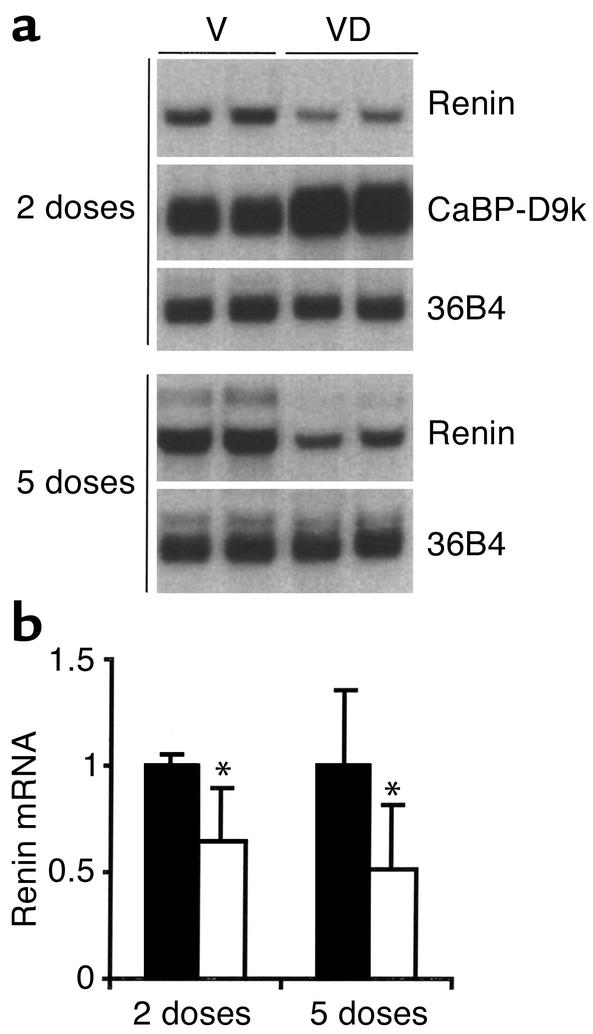
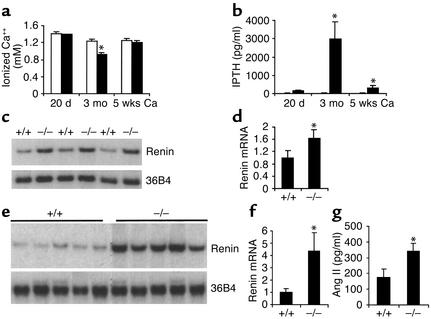
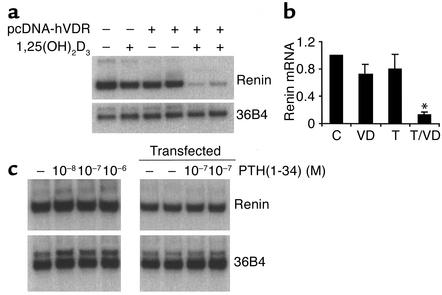
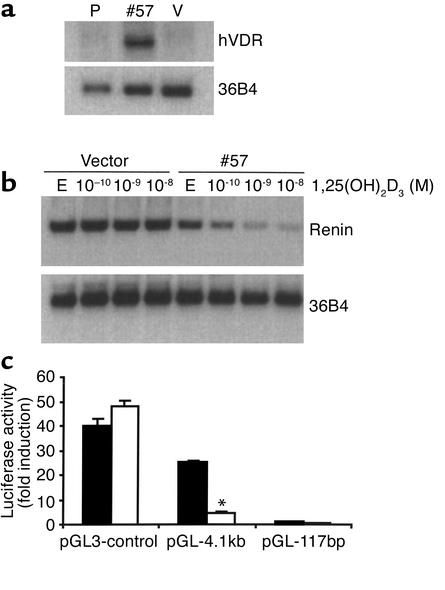
Inappropriate activation of the renin-angiotensin system, which plays a central role in the regulation of blood pressure, electrolyte, and volume homeostasis, may represent a major risk factor for hypertension, heart attack, and stroke. Mounting evidence from clinical studies has demonstrated an inverse relationship between circulating vitamin D levels and the blood pressure and/or plasma renin activity, but the mechanism is not understood. We show here that renin expression and plasma angiotensin II production were increased severalfold in vitamin D receptor-null (VDR-null) mice, leading to hypertension, cardiac hypertrophy, and increased water intake. However, the salt- and volume-sensing mechanisms that control renin synthesis are still intact in the mutant mice. In wild-type mice, inhibition of 1,25-dihydroxyvitamin D(3) [1,25(OH)(2)D(3)] synthesis also led to an increase in renin expression, whereas 1,25(OH)(2)D(3) injection led to renin suppression. We found that vitamin D regulation of renin expression was independent of calcium metabolism and that 1,25(OH)(2)D(3) markedly suppressed renin transcription by a VDR-mediated mechanism in cell cultures. Hence, 1,25(OH)(2)D(3) is a novel negative endocrine regulator of the renin-angiotensin system. Its apparent critical role in electrolytes, volume, and blood pressure homeostasis suggests that vitamin D analogues could help prevent or ameliorate hypertension.
Figures
Comment in
-
Regulation of renin expression and blood pressure by vitamin D(3).J Clin Invest. 2002 Jul;110(2):155-6. doi: 10.1172/JCI16160. J Clin Invest. 2002. PMID: 12122105 Free PMC article. Review. No abstract available.
-
Discovery of vitamin D hormone as a negative regulator of the renin-angiotensin system.Clin Chem. 2014 Mar;60(3):561-2. doi: 10.1373/clinchem.2013.216150. Epub 2013 Dec 20. Clin Chem. 2014. PMID: 24363372 No abstract available.
Similar articles
-
Vitamin D: a negative endocrine regulator of the renin-angiotensin system and blood pressure.J Steroid Biochem Mol Biol. 2004 May;89-90(1-5):387-92. doi: 10.1016/j.jsbmb.2004.03.004. J Steroid Biochem Mol Biol. 2004. PMID: 15225806 Review.
-
Administration of exogenous 1,25(OH)2D3 normalizes overactivation of the central renin-angiotensin system in 1α(OH)ase knockout mice.Neurosci Lett. 2015 Feb 19;588:184-9. doi: 10.1016/j.neulet.2015.01.013. Epub 2015 Jan 7. Neurosci Lett. 2015. PMID: 25576706
-
Vitamin D regulation of the renin-angiotensin system.J Cell Biochem. 2003 Feb 1;88(2):327-31. doi: 10.1002/jcb.10343. J Cell Biochem. 2003. PMID: 12520534 Review.
-
Cardiac hypertrophy in vitamin D receptor knockout mice: role of the systemic and cardiac renin-angiotensin systems.Am J Physiol Endocrinol Metab. 2005 Jan;288(1):E125-32. doi: 10.1152/ajpendo.00224.2004. Epub 2004 Sep 14. Am J Physiol Endocrinol Metab. 2005. PMID: 15367398
-
[Mechanism of urinary output inhibited by Vitamin D analogs in mice].Zhonghua Yi Xue Za Zhi. 2014 Mar 18;94(10):780-3. Zhonghua Yi Xue Za Zhi. 2014. PMID: 24844966 Chinese.
Cited by
-
Links between Vitamin D Deficiency and Cardiovascular Diseases.Biomed Res Int. 2015;2015:109275. doi: 10.1155/2015/109275. Epub 2015 Apr 27. Biomed Res Int. 2015. PMID: 26000280 Free PMC article. Review.
-
The Interplay Between the Renin-Angiotensin-Aldosterone System and Parathyroid Hormone.Front Endocrinol (Lausanne). 2020 Aug 20;11:539. doi: 10.3389/fendo.2020.00539. eCollection 2020. Front Endocrinol (Lausanne). 2020. PMID: 32973674 Free PMC article. Review.
-
The role of vitamin D in blood pressure, endothelial and renal function in postmenopausal women.Nutrients. 2013 Jul 9;5(7):2590-610. doi: 10.3390/nu5072590. Nutrients. 2013. PMID: 23839167 Free PMC article. Review.
-
Vitamin D - what is normal according to latest research and how should we deal with it?Clin Med (Lond). 2016 Apr;16(2):171-4. doi: 10.7861/clinmedicine.16-2-171. Clin Med (Lond). 2016. PMID: 27037388 Free PMC article.
-
Body mass index and 25 hydroxyvitamin D status in patients with and without heart failure.Congest Heart Fail. 2012 May-Jun;18(3):133-7. doi: 10.1111/j.1751-7133.2011.00270.x. Epub 2011 Nov 21. Congest Heart Fail. 2012. PMID: 22587742 Free PMC article.
References
-
- Ballermann, B.J., Zeidel, M.L., Gunning, M.E., and Brenner, B.M. 1991. Vasoactive peptides and the kidney. In The kidney. B.M. Brenner and F.C. Rector, editors. W.B. Saunders Co. Philadelphia, Pennsylvania, USA. 510–583.
-
- Hackenthal E, Paul M, Ganten D, Taugner R. Morphology, physiology, and molecular biology of renin secretion. Physiol Rev. 1990;70:1067–1116. - PubMed
-
- Ritthaler T, et al. Effects of endothelins on renin secretion from isolated mouse renal juxtaglomerular cells. Am J Physiol. 1995;268:F39–F45. - PubMed
-
- Shi Q, Gross KW, Sigmund CD. Retinoic acid-mediated activation of the mouse renin enhancer. J Biol Chem. 2001;276:3597–3603. - PubMed
Publication types
MeSH terms
Substances
Grants and funding
LinkOut - more resources
Full Text Sources
Other Literature Sources
Molecular Biology Databases
