

Pathway Processor: a tool for integrating whole-genome expression results into metabolic networks
- PMID: 12097350
- PMCID: PMC186628
- DOI: 10.1101/gr.226602
Pathway Processor: a tool for integrating whole-genome expression results into metabolic networks
Abstract
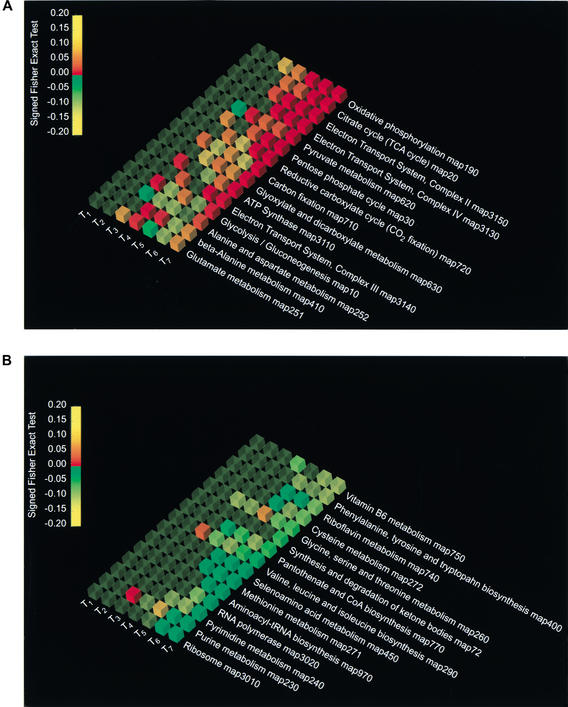
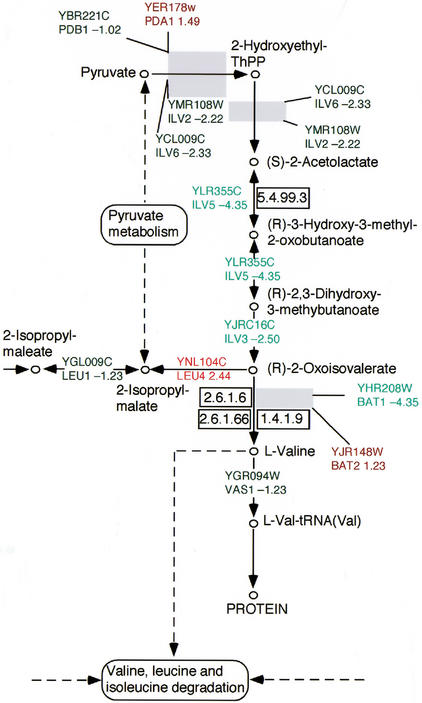
We have developed a new tool to visualize expression data on metabolic pathways and to evaluate which metabolic pathways are most affected by transcriptional changes in whole-genome expression experiments. Using the Fisher Exact Test, the method scores biochemical pathways according to the probability that as many or more genes in a pathway would be significantly altered in a given experiment by chance alone. This method has been validated on diauxic shift experiments and reproduces well known effects of carbon source on yeast metabolism. The analysis is implemented with Pathway Analyzer, one of the tools of Pathway Processor, a new statistical package for the analysis of whole-genome expression data. Results from multiple experiments can be compared, reducing the analysis from the full set of individual genes to a limited number of pathways of interest. The pathways are visualized with OpenDX, an open-source visualization software package, and the relationship between genes in the pathways can be examined in detail using Expression Mapper, the second program of the package. This program features a graphical output displaying differences in expression on metabolic charts of the biochemical pathways to which the open reading frames are assigned.
Figures
Similar articles
-
The transcriptional activator Cat8p provides a major contribution to the reprogramming of carbon metabolism during the diauxic shift in Saccharomyces cerevisiae.J Biol Chem. 2001 Jan 5;276(1):76-85. doi: 10.1074/jbc.M008752200. J Biol Chem. 2001. PMID: 11024040
-
Genome-wide analysis of mRNA lengths in Saccharomyces cerevisiae.Genome Biol. 2003;5(1):R2. doi: 10.1186/gb-2003-5-1-r2. Epub 2003 Dec 22. Genome Biol. 2003. PMID: 14709174 Free PMC article.
-
Quantitative analysis of wine yeast gene expression profiles under winemaking conditions.Yeast. 2005 Apr 15;22(5):369-83. doi: 10.1002/yea.1217. Yeast. 2005. PMID: 15806604
-
Functional analysis of the yeast genome.Curr Opin Genet Dev. 1997 Dec;7(6):771-6. doi: 10.1016/s0959-437x(97)80039-1. Curr Opin Genet Dev. 1997. PMID: 9468786 Review.
-
Fungal genomics beyond Saccharomyces cerevisiae?Curr Opin Biotechnol. 2003 Apr;14(2):226-31. doi: 10.1016/s0958-1669(03)00020-x. Curr Opin Biotechnol. 2003. PMID: 12732326 Review.
Cited by
-
Pathway Processor 2.0: a web resource for pathway-based analysis of high-throughput data.Bioinformatics. 2013 Jul 15;29(14):1825-6. doi: 10.1093/bioinformatics/btt292. Epub 2013 Jun 5. Bioinformatics. 2013. PMID: 23740747 Free PMC article.
-
Global gene expression analysis in liver of obese diabetic db/db mice treated with metformin.Diabetologia. 2006 Jul;49(7):1647-55. doi: 10.1007/s00125-006-0271-y. Epub 2006 May 23. Diabetologia. 2006. PMID: 16752183
-
MADNet: microarray database network web server.Nucleic Acids Res. 2008 Jul 1;36(Web Server issue):W332-5. doi: 10.1093/nar/gkn289. Epub 2008 May 14. Nucleic Acids Res. 2008. PMID: 18480121 Free PMC article.
-
Multi-membership gene regulation in pathway based microarray analysis.Algorithms Mol Biol. 2011 Sep 22;6:22. doi: 10.1186/1748-7188-6-22. Algorithms Mol Biol. 2011. PMID: 21939531 Free PMC article.
-
Using pathway signatures as means of identifying similarities among microarray experiments.PLoS One. 2009;4(1):e4128. doi: 10.1371/journal.pone.0004128. Epub 2009 Jan 6. PLoS One. 2009. PMID: 19125200 Free PMC article.
References
-
- Costanzo MC, Hogan JD, Cusick ME, Davis BP, Fancher AM, Hodges PE, Kondu P, Lengieza C, Lew-Smith JE, Lingner C, et al. The yeast proteome database (YPD) and Caenorhabditis elegans proteome database (WormPD): Comprehensive resources for the organization and comparison of model organism protein information. Nucleic Acids Res. 2000;28:73–76. - PMC - PubMed
-
- DeRisi JL, Iyer VR, Brown PO. Exploring the metabolic and genetic control of gene expression on a genomic scale. Science. 1997;278:680–686. - PubMed
Publication types
MeSH terms
LinkOut - more resources
Full Text Sources
Molecular Biology Databases