A deletion-generator compound element allows deletion saturation analysis for genomewide phenotypic annotation
- PMID: 12096187
- PMCID: PMC126605
- DOI: 10.1073/pnas.142310099
A deletion-generator compound element allows deletion saturation analysis for genomewide phenotypic annotation
Abstract
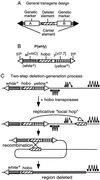
With the available eukaryotic genome sequences, there are predictions of thousands of previously uncharacterized genes without known function or available mutational variant. Thus, there is an urgent need for efficient genetic tools for genomewide phenotypic analysis. Here we describe such a tool: a deletion-generator technology that exploits properties of a double transposable element to produce molecularly defined deletions at high density and with high efficiency. This double element, called P[wHy], is composed of a "deleter" element hobo, bracketed by two genetic markers and inserted into a "carrier" P element. We have used this P[wHy] element in Drosophila melanogaster to generate sets of nested deletions of sufficient coverage to discriminate among every transcription unit within 60 kb of the starting insertion site. Because these two types of mobile elements, carrier and deleter, can be found in other species, our strategy should be applicable to phenotypic analysis in a variety of model organisms.
Figures


Comment in
-
Another arrow in the Drosophila quiver.Proc Natl Acad Sci U S A. 2002 Jul 23;99(15):9607-8. doi: 10.1073/pnas.172377099. Epub 2002 Jul 16. Proc Natl Acad Sci U S A. 2002. PMID: 12122216 Free PMC article. No abstract available.
Similar articles
-
Large-scale functional annotation and expanded implementations of the P{wHy} hybrid transposon in the Drosophila melanogaster genome.Genetics. 2009 Jul;182(3):653-60. doi: 10.1534/genetics.109.103762. Epub 2009 Apr 27. Genetics. 2009. PMID: 19398769 Free PMC article.
-
Using the P[wHy] hybrid transposable element to disrupt genes in region 54D-55B in Drosophila melanogaster.Genetics. 2002 Sep;162(1):165-76. doi: 10.1093/genetics/162.1.165. Genetics. 2002. PMID: 12242231 Free PMC article.
-
Genetic instability in Drosophila melanogaster mediated by hobo transposable elements.Genetics. 1993 Feb;133(2):315-34. doi: 10.1093/genetics/133.2.315. Genetics. 1993. PMID: 8382175 Free PMC article.
-
The evolutionary genetics of the hobo transposable element in the Drosophila melanogaster complex.Genetica. 1994;93(1-3):79-90. doi: 10.1007/BF01435241. Genetica. 1994. PMID: 7813919 Review.
-
Mobile genetic elements in Drosophila melanogaster (recent experiments).Genome. 1989;31(2):920-8. doi: 10.1139/g89-163. Genome. 1989. PMID: 2561113 Review.
Cited by
-
The BDGP gene disruption project: single transposon insertions associated with 40% of Drosophila genes.Genetics. 2004 Jun;167(2):761-81. doi: 10.1534/genetics.104.026427. Genetics. 2004. PMID: 15238527 Free PMC article.
-
The DrosDel collection: a set of P-element insertions for generating custom chromosomal aberrations in Drosophila melanogaster.Genetics. 2004 Jun;167(2):797-813. doi: 10.1534/genetics.104.026658. Genetics. 2004. PMID: 15238529 Free PMC article.
-
The generation of chromosomal deletions to provide extensive coverage and subdivision of the Drosophila melanogaster genome.Genome Biol. 2012;13(3):R21. doi: 10.1186/gb-2012-13-3-r21. Genome Biol. 2012. PMID: 22445104 Free PMC article.
-
Coordinated expression of cell death genes regulates neuroblast apoptosis.Development. 2011 Jun;138(11):2197-206. doi: 10.1242/dev.058826. Development. 2011. PMID: 21558369 Free PMC article.
-
Genetic manipulation of genes and cells in the nervous system of the fruit fly.Neuron. 2011 Oct 20;72(2):202-30. doi: 10.1016/j.neuron.2011.09.021. Neuron. 2011. PMID: 22017985 Free PMC article.
References
-
- Adams M D, Celniker S E, Holt R A, Evans C A, Gocayne J D, Amanatides P G, Scherer S E, Li P W, Hoskins R A, Galle R F, et al. Science. 2000;287:2185–2195. - PubMed
-
- The Caenorhabditis elegans Sequencing Consortium. Science. 1998;282:2012–2018. - PubMed
-
- The Arabidopsis Genome Initiative. Nature (London) 2000;408:796–812. - PubMed
-
- International Human Genome Sequencing Consortium. Nature (London) 2001;409:860–921. - PubMed
-
- Venter J C, Adams M D, Myers E W, Li P W, Mural R J, Sutton G G, Smith H O, Yandell M, Evans C A, Holt R A, et al. Science. 2001;291:1304–1351. - PubMed
Publication types
MeSH terms
Associated data
- Actions
- Actions
- Actions
- Actions
- Actions
- Actions
- Actions
- Actions
- Actions
- Actions
- Actions
- Actions
- Actions
- Actions
- Actions
- Actions
- Actions
- Actions
- Actions
- Actions
- Actions
- Actions
- Actions
- Actions
- Actions
- Actions
- Actions
- Actions
- Actions
- Actions
- Actions
- Actions
- Actions
- Actions
- Actions
- Actions
- Actions
- Actions
- Actions
- Actions
- Actions
- Actions
- Actions
- Actions
- Actions
- Actions
- Actions
- Actions
- Actions
- Actions
- Actions
- Actions
- Actions
- Actions
- Actions
- Actions
- Actions
- Actions
- Actions
- Actions
- Actions
- Actions
- Actions
- Actions
- Actions
- Actions
- Actions
- Actions
- Actions
- Actions
- Actions
- Actions
- Actions
- Actions
- Actions
- Actions
- Actions
- Actions
- Actions
- Actions
- Actions
- Actions
- Actions
- Actions
- Actions
- Actions
- Actions
- Actions
- Actions
- Actions
- Actions
- Actions
- Actions
- Actions
- Actions
- Actions
- Actions
- Actions
- Actions
- Actions
- Actions
- Actions
- Actions
- Actions
- Actions
- Actions
- Actions
- Actions
- Actions
- Actions
- Actions
- Actions
- Actions
- Actions
- Actions
- Actions
Grants and funding
LinkOut - more resources
Full Text Sources
Molecular Biology Databases

