Modulation of synchrony between single motor units during precision grip tasks in humans
- PMID: 12068052
- PMCID: PMC2290366
- DOI: 10.1113/jphysiol.2001.013305
Modulation of synchrony between single motor units during precision grip tasks in humans
Abstract
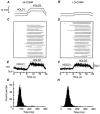
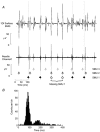
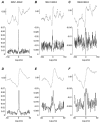
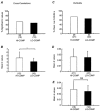
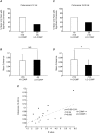
During precision grip, coherence between motor cortex and hand muscle EMG oscillatory activity in the 15-30 Hz range covaries with the compliance of the manipulated object. The current study investigated whether short-term synchrony and coherence between discharges of single motor units (SMUs) in the first dorsal interosseous (1DI) muscle were similarly modulated by object compliance during precision grip. Eight subjects used index finger and thumb to grip two levers that were under robotic control. Guided by visual feedback of the lever force levels, subjects held the levers against a steady force of 1.3 N for 8 s; they then linearly increased the force to 1.6 N over a 2 s period and held for a further 8 s before linearly decreasing the force back to the 1.3 N level over another 2 s period. Subjects performed the task at two different levels of compliance, each with identical grip force levels. Both surface EMG and SMU activity were recorded from the 1DI muscle. Short-term synchrony between the discharges of pairs of SMUs was assessed in the time domain by cross-correlation and in the frequency domain by coherence analysis. Coherence was seen in two frequency ranges: 6-12 Hz and 15-30 Hz. The compliance of the gripped object had a significant effect on both short-term synchronisation and coherence in the 15-30 Hz range between SMUs; both were greater for the more compliant condition. There was no change in the 6-12 Hz coherence.
Figures


Similar articles
-
Task-dependent modulation of 15-30 Hz coherence between rectified EMGs from human hand and forearm muscles.J Physiol. 1999 Apr 15;516 ( Pt 2)(Pt 2):559-70. doi: 10.1111/j.1469-7793.1999.0559v.x. J Physiol. 1999. PMID: 10087353 Free PMC article. Clinical Trial.
-
Digital nerve anaesthesia decreases EMG-EMG coherence in a human precision grip task.Exp Brain Res. 2002 Jul;145(2):207-14. doi: 10.1007/s00221-002-1113-x. Epub 2002 May 16. Exp Brain Res. 2002. PMID: 12110961
-
Human cortical muscle coherence is directly related to specific motor parameters.J Neurosci. 2000 Dec 1;20(23):8838-45. doi: 10.1523/JNEUROSCI.20-23-08838.2000. J Neurosci. 2000. PMID: 11102492 Free PMC article. Clinical Trial.
-
A novel algorithm to remove electrical cross-talk between surface EMG recordings and its application to the measurement of short-term synchronisation in humans.J Physiol. 2002 Feb 1;538(Pt 3):919-30. doi: 10.1113/jphysiol.2001.012950. J Physiol. 2002. PMID: 11826175 Free PMC article.
-
Neural control of hand muscles during prehension.Adv Exp Med Biol. 2009;629:577-96. doi: 10.1007/978-0-387-77064-2_31. Adv Exp Med Biol. 2009. PMID: 19227522 Review.
Cited by
-
Intermittent visuomotor processing in the human cerebellum, parietal cortex, and premotor cortex.J Neurophysiol. 2006 Feb;95(2):922-31. doi: 10.1152/jn.00718.2005. Epub 2005 Nov 2. J Neurophysiol. 2006. PMID: 16267114 Free PMC article. Clinical Trial.
-
Common input to motor units of intrinsic and extrinsic hand muscles during two-digit object hold.J Neurophysiol. 2008 Mar;99(3):1119-26. doi: 10.1152/jn.01059.2007. Epub 2008 Jan 2. J Neurophysiol. 2008. PMID: 18171707 Free PMC article.
-
Involuntary Neuromuscular Coupling between the Thumb and Finger of Stroke Survivors during Dynamic Movement.Front Neurol. 2018 Mar 1;9:84. doi: 10.3389/fneur.2018.00084. eCollection 2018. Front Neurol. 2018. PMID: 29545767 Free PMC article.
-
Corticomuscular synchronization with small and large dynamic force output.BMC Neurosci. 2007 Nov 27;8:101. doi: 10.1186/1471-2202-8-101. BMC Neurosci. 2007. PMID: 18042289 Free PMC article.
-
Is the human masticatory system devoid of recurrent inhibition?Exp Brain Res. 2007 May;179(1):131-44. doi: 10.1007/s00221-006-0774-2. Epub 2006 Nov 30. Exp Brain Res. 2007. PMID: 17136531
References
-
- Baker SN. Quantification of the relative efficacies of asynchronous and oscillating inputs to a motoneurone pool using a computer model. Journal of Physiology. 1997;504:116.
-
- Baker SN, Spinks R, Jackson A, Lemon RN. Synchronization in monkey motor cortex during a precision grip task. I. Task-dependent modulation in single-unit synchrony. Journal of Neurophysiology. 2001;85:869–885. - PubMed
-
- Bremner FD, Baker JR, Stephens JA. Effect of task on the degree of synchronization of intrinsic hand muscle motor units in man. Journal of Neurophysiology. 1991a;66:2072–2083. - PubMed
Publication types
MeSH terms
LinkOut - more resources
Full Text Sources

