

Permissive proteolytic activity for visual cortical plasticity
- PMID: 12032349
- PMCID: PMC124331
- DOI: 10.1073/pnas.102088899
Permissive proteolytic activity for visual cortical plasticity
Abstract
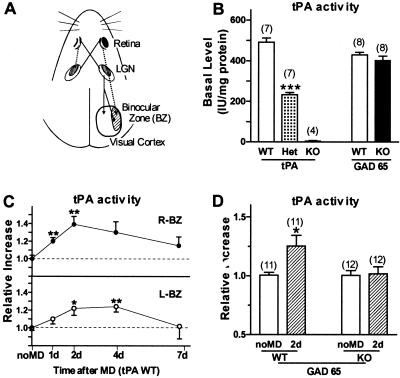
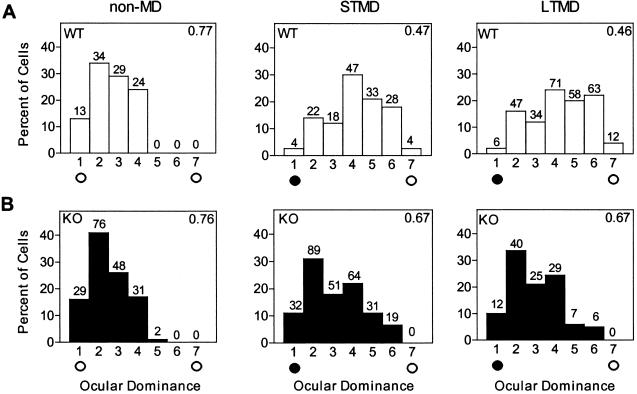
The serine protease, tissue-type plasminogen activator (tPA) is a key regulator of extracellular proteolytic cascades. We demonstrate a requirement for tPA signaling in the experience-dependent plasticity of mouse visual cortex during the developmental critical period. Proteolytic activity by tPA in the binocular zone was typically increased within 2 days of monocular deprivation (MD). This regulation failed to occur in glutamic acid decarboxylase (GAD) 65 knockout mice, an animal model of impaired ocular dominance plasticity because of reduced gamma-aminobutyric acid (GABA)-mediated transmission described previously. Loss of responsiveness to the deprived eye consequent to MD was conversely suppressed in mice lacking tPA despite normal levels of neuronal activity. Plasticity was restored in a gene dose-dependent manner, or by direct tPA infusion. Permissive amounts of tPA may, thus, couple functional to structural changes downstream of the excitatory-inhibitory balance that triggers visual cortical plasticity. Our results not only support a molecular cascade leading to neurite outgrowth after sensory deprivation, but also identify a valuable tool for further proteomic and genomic dissection of experience-dependent plasticity downstream of electrical activity.
Figures


Similar articles
-
Experience-dependent pruning of dendritic spines in visual cortex by tissue plasminogen activator.Neuron. 2004 Dec 16;44(6):1031-41. doi: 10.1016/j.neuron.2004.11.028. Neuron. 2004. PMID: 15603745
-
Rapid critical period induction by tonic inhibition in visual cortex.J Neurosci. 2003 Jul 30;23(17):6695-702. doi: 10.1523/JNEUROSCI.23-17-06695.2003. J Neurosci. 2003. PMID: 12890762 Free PMC article.
-
Gene expression changes and molecular pathways mediating activity-dependent plasticity in visual cortex.Nat Neurosci. 2006 May;9(5):660-8. doi: 10.1038/nn1689. Epub 2006 Apr 23. Nat Neurosci. 2006. PMID: 16633343
-
Lifelong learning: ocular dominance plasticity in mouse visual cortex.Curr Opin Neurobiol. 2006 Aug;16(4):451-9. doi: 10.1016/j.conb.2006.06.007. Epub 2006 Jul 11. Curr Opin Neurobiol. 2006. PMID: 16837188 Review.
-
Critical period mechanisms in developing visual cortex.Curr Top Dev Biol. 2005;69:215-37. doi: 10.1016/S0070-2153(05)69008-4. Curr Top Dev Biol. 2005. PMID: 16243601 Review.
Cited by
-
Neuroserpin protects neurons from ischemia-induced plasmin-mediated cell death independently of tissue-type plasminogen activator inhibition.Am J Pathol. 2010 Nov;177(5):2576-84. doi: 10.2353/ajpath.2010.100466. Epub 2010 Sep 23. Am J Pathol. 2010. PMID: 20864675 Free PMC article.
-
Postnatal expression profile of OBCAM implies its involvement in visual cortex development and plasticity.Cereb Cortex. 2006 Feb;16(2):291-9. doi: 10.1093/cercor/bhi109. Epub 2005 May 18. Cereb Cortex. 2006. PMID: 15901654 Free PMC article.
-
Classical MHCI molecules regulate retinogeniculate refinement and limit ocular dominance plasticity.Neuron. 2009 Nov 25;64(4):463-70. doi: 10.1016/j.neuron.2009.10.015. Neuron. 2009. PMID: 19945389 Free PMC article.
-
Tumor necrosis factor-alpha mediates one component of competitive, experience-dependent plasticity in developing visual cortex.Neuron. 2008 Jun 12;58(5):673-80. doi: 10.1016/j.neuron.2008.04.023. Neuron. 2008. PMID: 18549780 Free PMC article.
-
Proteolytic regulation of synaptic plasticity in the mouse primary visual cortex: analysis of matrix metalloproteinase 9 deficient mice.Front Cell Neurosci. 2015 Sep 22;9:369. doi: 10.3389/fncel.2015.00369. eCollection 2015. Front Cell Neurosci. 2015. PMID: 26441540 Free PMC article.
References
Publication types
MeSH terms
Substances
LinkOut - more resources
Full Text Sources
Other Literature Sources
Molecular Biology Databases
