

Selective alteration of gene expression in response to natural and synthetic retinoids
- PMID: 12019025
- PMCID: PMC113761
- DOI: 10.1186/1471-2210-2-13
Selective alteration of gene expression in response to natural and synthetic retinoids
Abstract
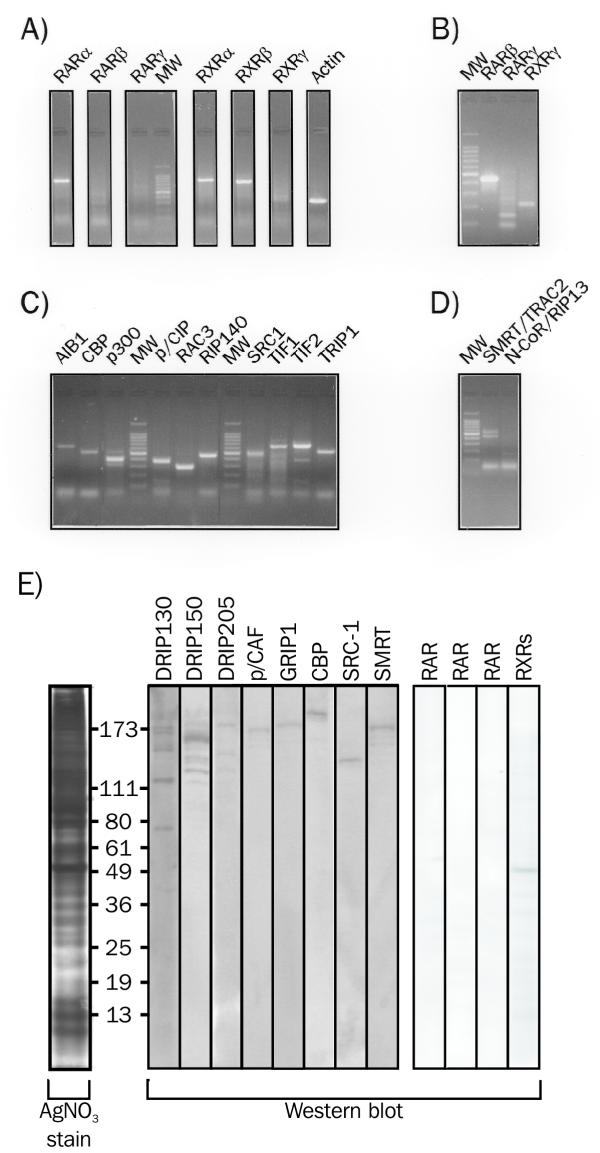
Background: Retinoids are very potent inducers of cellular differentiation and apoptosis, and are efficient anti-tumoral agents. Synthetic retinoids are designed to restrict their toxicity and side effects, mostly by increasing their selectivity toward each isotype of retinoic acids receptors (RARalpha,beta, gamma and RXRalpha, beta, gamma). We however previously showed that retinoids displayed very different abilities to activate retinoid-inducible reporter genes, and that these differential properties were correlated to the ability of a given ligand to promote SRC-1 recruitment by DNA-bound RXR:RAR heterodimers. This suggested that gene-selective modulation could be achieved by structurally distinct retinoids.
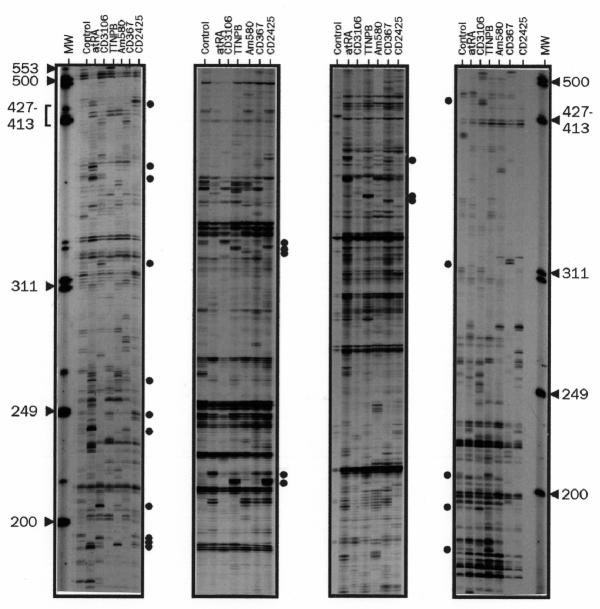
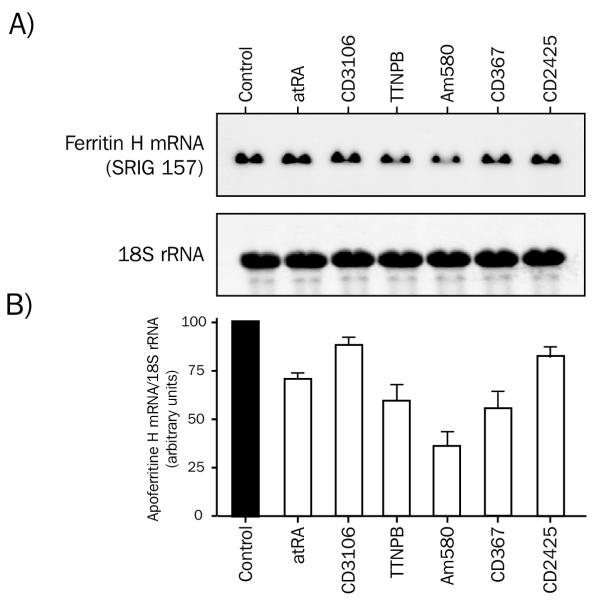
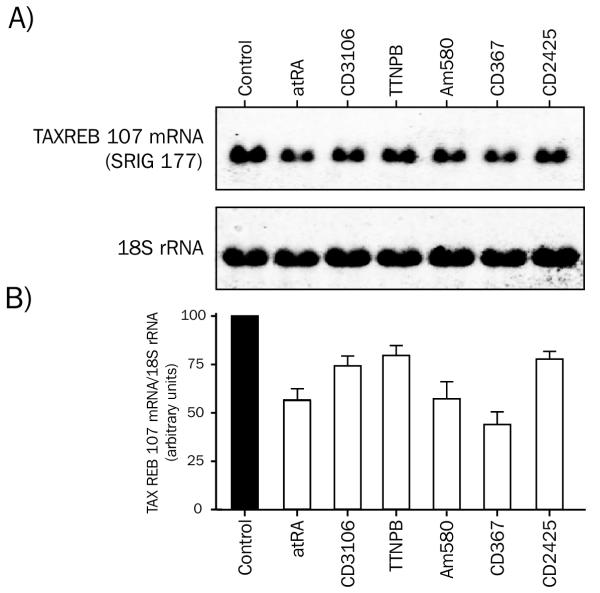
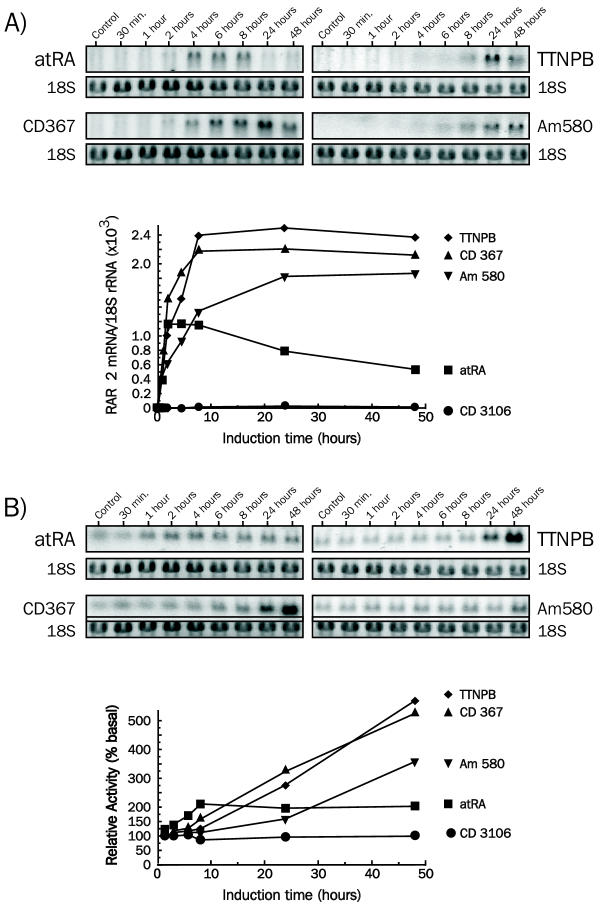
Results: Using the differential display mRNA technique, we identified several genes on the basis of their differential induction by natural or synthetic retinoids in human cervix adenocarcinoma cells. Furthermore, this differential ability to regulate promoter activities was also observed in murine P19 cells for the RARbeta2 and CRABPII gene, showing conclusively that retinoid structure has a dramatic impact on the regulation of endogenous genes.
Conclusions: Our findings therefore show that some degree of selective induction or repression of gene expression may be achieved when using appropriately designed ligands for retinoic acid receptors, extending the concept of selective modulators from estrogen and peroxisome proliferator activated receptors to the class of retinoid receptors.
Figures
Similar articles
-
Differential regulation of human ectocervical epithelial cell line proliferation and differentiation by retinoid X receptor- and retinoic acid receptor-specific retinoids.Cell Growth Differ. 1996 Apr;7(4):521-30. Cell Growth Differ. 1996. PMID: 9052993
-
Identification of a novel class of retinoic acid receptor beta-selective retinoid antagonists and their inhibitory effects on AP-1 activity and retinoic acid-induced apoptosis in human breast cancer cells.J Biol Chem. 1999 May 28;274(22):15360-6. doi: 10.1074/jbc.274.22.15360. J Biol Chem. 1999. PMID: 10336422
-
Identification of receptor-selective retinoids that are potent inhibitors of the growth of human head and neck squamous cell carcinoma cells.Clin Cancer Res. 2000 Apr;6(4):1563-73. Clin Cancer Res. 2000. PMID: 10778990
-
Recent developments in receptor-selective retinoids.Curr Pharm Des. 2000 Jun;6(9):919-31. doi: 10.2174/1381612003400146. Curr Pharm Des. 2000. PMID: 10828316 Review.
-
[Retinoids: mechanisms of action].Ann Dermatol Venereol. 2010 Nov;137 Suppl 3:S97-103. doi: 10.1016/S0151-9638(10)70036-3. Ann Dermatol Venereol. 2010. PMID: 21185985 Review. French.
Cited by
-
The effects of retinoic acid on the insulin-like growth factor axis in primary tissue culture from hyperparathyroidism.World J Surg. 2006 May;30(5):714-20. doi: 10.1007/s00268-005-0340-2. World J Surg. 2006. PMID: 16680587
-
Retinoic acid inhibits endometrial cancer cell growth via multiple genomic mechanisms.J Mol Endocrinol. 2011 Mar 23;46(2):139-53. doi: 10.1530/JME-10-0064. Print 2011 Apr. J Mol Endocrinol. 2011. PMID: 21310893 Free PMC article.
-
The elongation complex components BRD4 and MLLT3/AF9 are transcriptional coactivators of nuclear retinoid receptors.PLoS One. 2013 Jun 10;8(6):e64880. doi: 10.1371/journal.pone.0064880. Print 2013. PLoS One. 2013. PMID: 23762261 Free PMC article.
-
The proliferating cell nuclear antigen regulates retinoic acid receptor transcriptional activity through direct protein-protein interaction.Nucleic Acids Res. 2005 Jul 29;33(13):4311-21. doi: 10.1093/nar/gki745. Print 2005. Nucleic Acids Res. 2005. PMID: 16055921 Free PMC article.
-
All-trans retinoic acid inhibits craniopharyngioma cell growth: study on an explant cell model.J Neurooncol. 2013 May;112(3):355-64. doi: 10.1007/s11060-013-1080-z. Epub 2013 Feb 20. J Neurooncol. 2013. PMID: 23423514
References
-
- Lingen MW, Polverini PJ, Bouck NP. Retinoic acid and interferon alpha act synergistically as antiangiogenic and antitumor agents against human head and neck squamous cell carcinoma. Cancer Res. 1998;58:5551–5558. - PubMed
Publication types
MeSH terms
Substances
LinkOut - more resources
Full Text Sources
Miscellaneous
