

doi: 10.1073/pnas.082099299.
Diagnosis of multiple cancer types by shrunken centroids of gene expression
Affiliations
- PMID: 12011421
- PMCID: PMC124443
- DOI: 10.1073/pnas.082099299
Item in Clipboard
Diagnosis of multiple cancer types by shrunken centroids of gene expression
Proc Natl Acad Sci U S A.
.
Abstract
We have devised an approach to cancer class prediction from gene expression profiling, based on an enhancement of the simple nearest prototype (centroid) classifier. We shrink the prototypes and hence obtain a classifier that is often more accurate than competing methods. Our method of "nearest shrunken centroids" identifies subsets of genes that best characterize each class. The technique is general and can be used in many other classification problems. To demonstrate its effectiveness, we show that the method was highly efficient in finding genes for classifying small round blue cell tumors and leukemias.
Figures
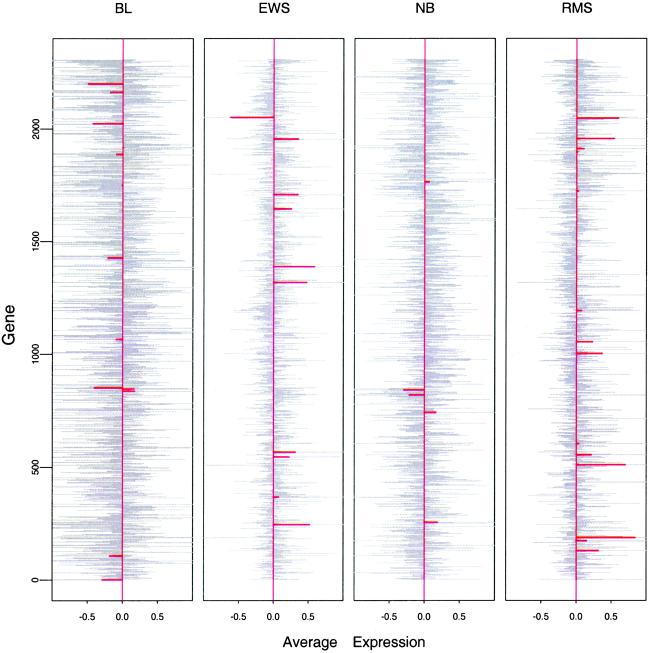
Centroids (grey) and shrunken centroids (red) for the SRBCT dataset. The overall centroid has been subtracted from the centroid from each class. The horizontal units are log ratios of expression. From left to right, the numbers of training samples for each class are 8, 23, 12, and 20. The order of the genes is arbitrary.
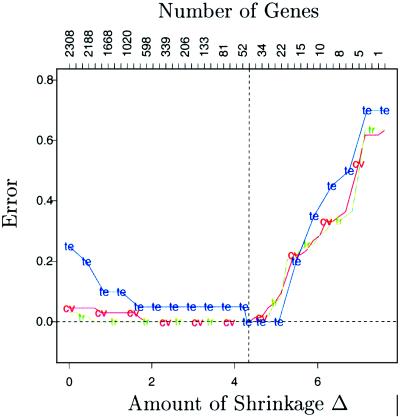
SBRCT classification: training (tr, green), cross-validation (cv, red), and test (te, blue) errors are shown as a function of the threshold parameter Δ. The value Δ = 4.34 is chosen and yields a subset of 43 selected genes.
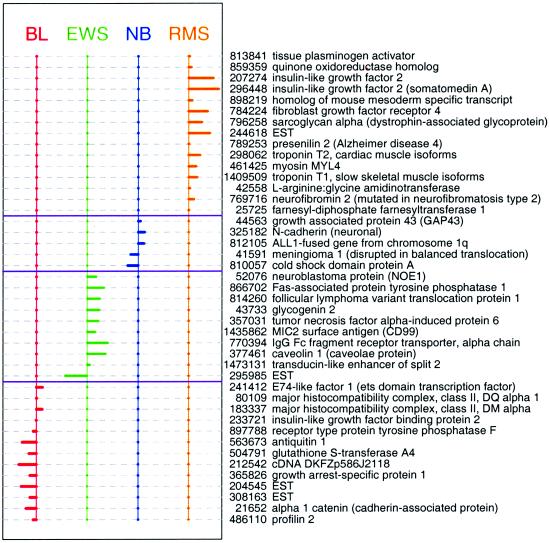
Shrunken differences d′ik for the 43 genes having at least one nonzero difference. The genes with nonzero components in each class are almost mutually exclusive.

(Top) Heat map of the chosen 43 genes. Within each of the horizontal partitions, we have ordered the genes by hierarchical clustering, and similarly for the samples within each vertical partition. (Bottom) Heat map of three genes reported in the literature to characterize SRBCT tumors. They are c-myc (Top), CD45 (Middle) and myogenin (Bottom).
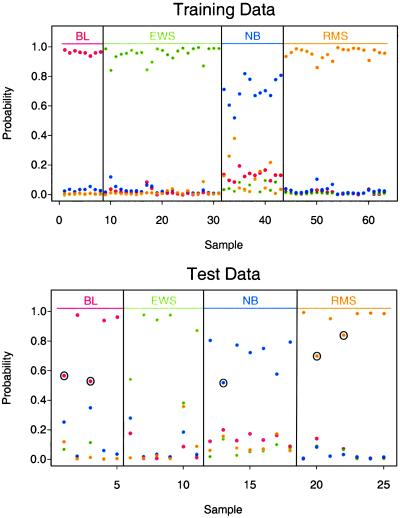
Estimated probabilities for the training data (Upper) and test data (Lower). Samples are partitioned by the true class (Upper) and the predicted class (Lower). All 63 of the training samples and all 20 of the test samples known to be SRBCT are correctly classified. Five of the test samples were non-SRBCT and hence should not be classified as such. The maximum estimated probability for each of these five samples is marked with a circle; they are below the maximum probabilities for the other test samples in each class.
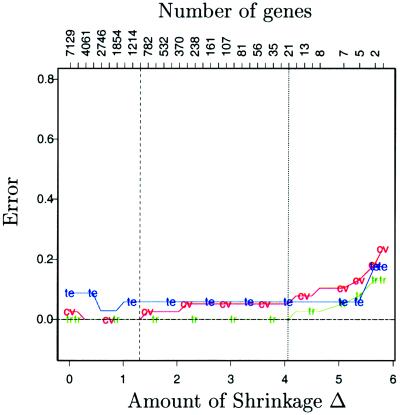
Leukemia classification: training (tr, green), cross-validation (cv, red), and test (te, blue) errors. The value Δ = 4.06 yields a subset of 21 genes.
Similar articles
-
Simultaneous variable selection and class fusion for high-dimensional linear discriminant analysis.Biostatistics. 2010 Oct;11(4):599-608. doi: 10.1093/biostatistics/kxq023. Epub 2010 May 26. Biostatistics. 2010. PMID: 20505058
-
Classification of multiple cancer types by multicategory support vector machines using gene expression data.Bioinformatics. 2003 Jun 12;19(9):1132-9. doi: 10.1093/bioinformatics/btg102. Bioinformatics. 2003. PMID: 12801874
-
Improved centroids estimation for the nearest shrunken centroid classifier.Bioinformatics. 2007 Apr 15;23(8):972-9. doi: 10.1093/bioinformatics/btm046. Epub 2007 Mar 24. Bioinformatics. 2007. PMID: 17384429
-
[The clinical significance of fluorocytometry of the cell cycle in acute lymphoblastic leukemias in children].Rev Med Brux. 1988 Oct;9(7-8):367-74. Rev Med Brux. 1988. PMID: 3055136 Review. French. No abstract available.
-
Gene expression profiling in acute myeloid leukemia.Curr Opin Hematol. 2005 Jan;12(1):76-81. doi: 10.1097/01.moh.0000149610.14438.9a. Curr Opin Hematol. 2005. PMID: 15604895 Review.
Cited by
-
Implementing Mass Cytometry at the Bedside to Study the Immunological Basis of Human Diseases: Distinctive Immune Features in Patients with a History of Term or Preterm Birth.Cytometry A. 2015 Sep;87(9):817-29. doi: 10.1002/cyto.a.22720. Epub 2015 Jul 17. Cytometry A. 2015. PMID: 26190063 Free PMC article.
-
A Simple Method for Estimating Interactions between a Treatment and a Large Number of Covariates.J Am Stat Assoc. 2014 Oct;109(508):1517-1532. doi: 10.1080/01621459.2014.951443. J Am Stat Assoc. 2014. PMID: 25729117 Free PMC article.
-
An investigation of biomarkers derived from legacy microarray data for their utility in the RNA-seq era.Genome Biol. 2014 Dec 3;15(12):523. doi: 10.1186/s13059-014-0523-y. Genome Biol. 2014. PMID: 25633159 Free PMC article.
-
Peptidomic Identification of Serum Peptides Diagnosing Preeclampsia.PLoS One. 2013 Jun 19;8(6):e65571. doi: 10.1371/journal.pone.0065571. Print 2013. PLoS One. 2013. PMID: 23840341 Free PMC article.
-
Identification of a multi-cancer gene expression biomarker for cancer clinical outcomes using a network-based algorithm.Sci Rep. 2015 Jul 23;5:11966. doi: 10.1038/srep11966. Sci Rep. 2015. PMID: 26202601 Free PMC article.
References
-
- Golub T, Slonim D, Tamayo P, Huard C, Gaasenbeek M, Mesirov J, Coller H, Loh M, Downing J, Caligiuri M, et al. Science. 1999;286:531–536. - PubMed
-
- Hedenfalk I, Duggan D, Chen Y, Radmacher M, Bittner M, Simon R, Meltzer P, Gusterson B, Esteller M, Raffeld M, et al. N Engl J Med. 2001;344:539–548. - PubMed
-
- Hastie T, Tibshirani R, Friedman J. The Elements of Statistical Learning; Data Mining, Inference and Prediction. New York: Springer; 2001.
Publication types
MeSH terms
Substances
Grants and funding
LinkOut - more resources
Full Text Sources
Other Literature Sources
Medical
