. 2002 May;119(5):487-507.
doi: 10.1085/jgp.20028551.

Separation and characterization of currents through store-operated CRAC channels and Mg2+-inhibited cation (MIC) channels

Affiliations

Separation and characterization of currents through store-operated CRAC channels and Mg2+-inhibited cation (MIC) channels

Murali Prakriya et al. J Gen Physiol. 2002 May.

Erratum in

  • J Gen Physiol 2002 Jun;119(6):613

Abstract

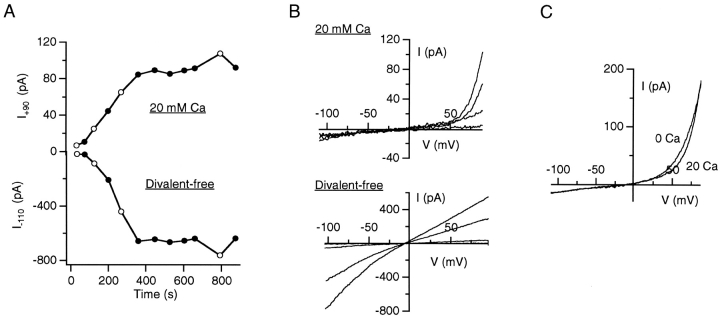
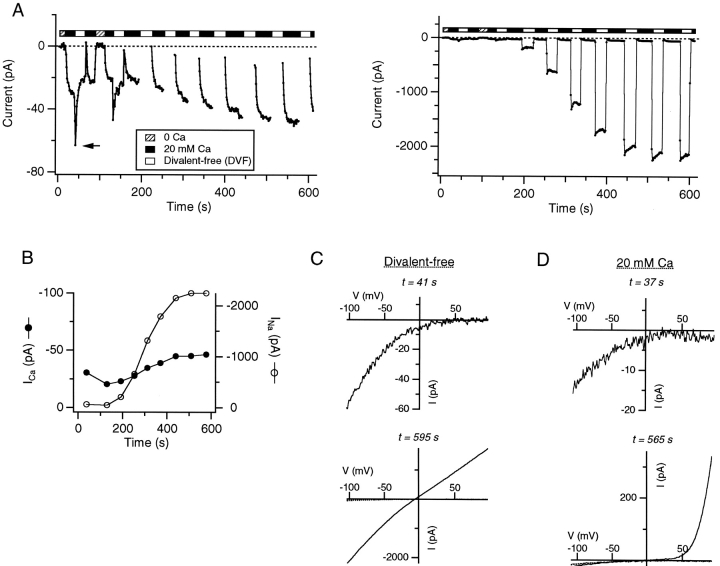
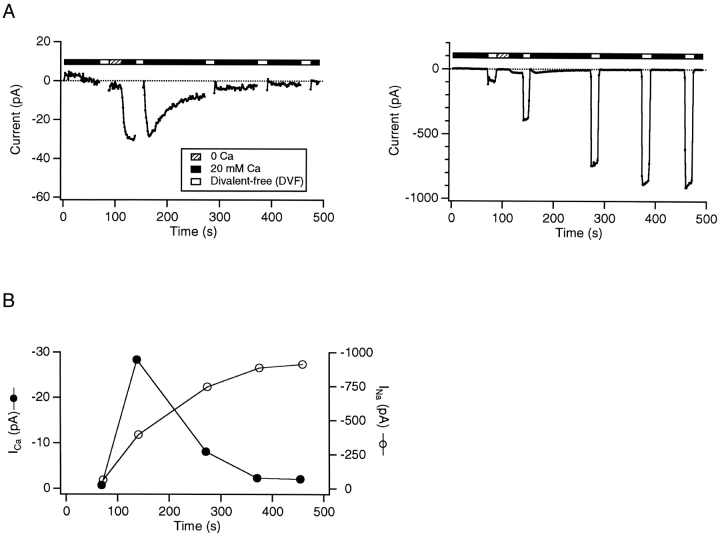
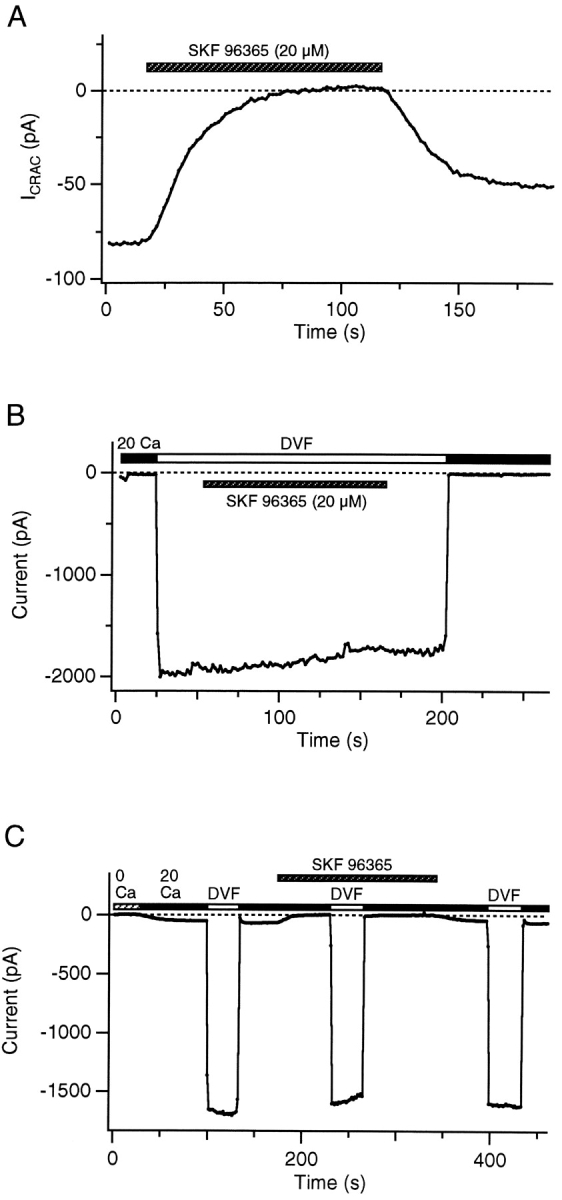
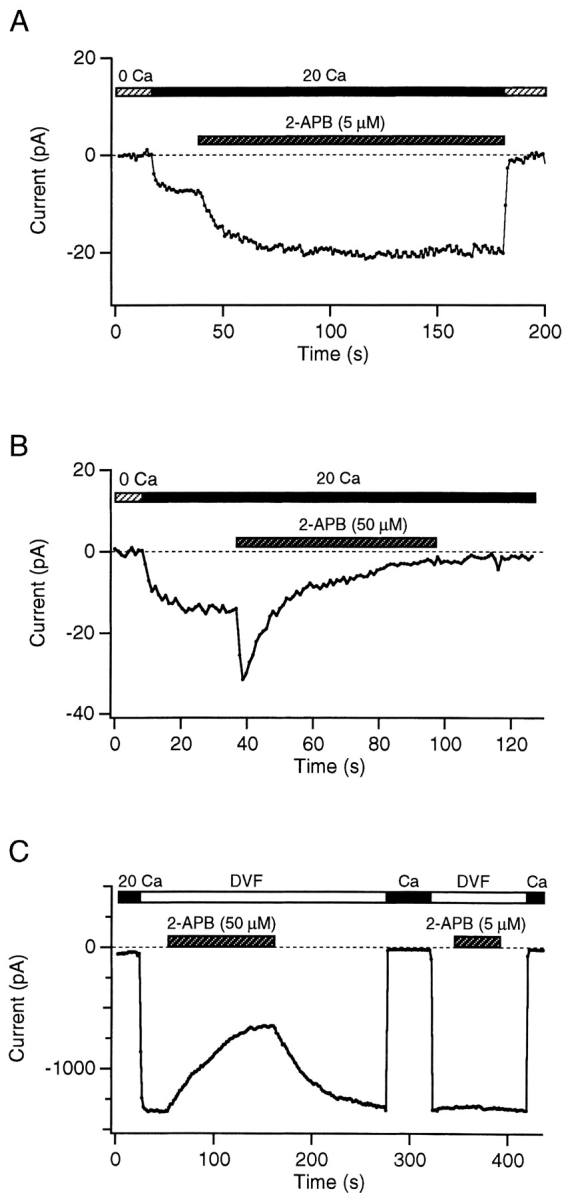
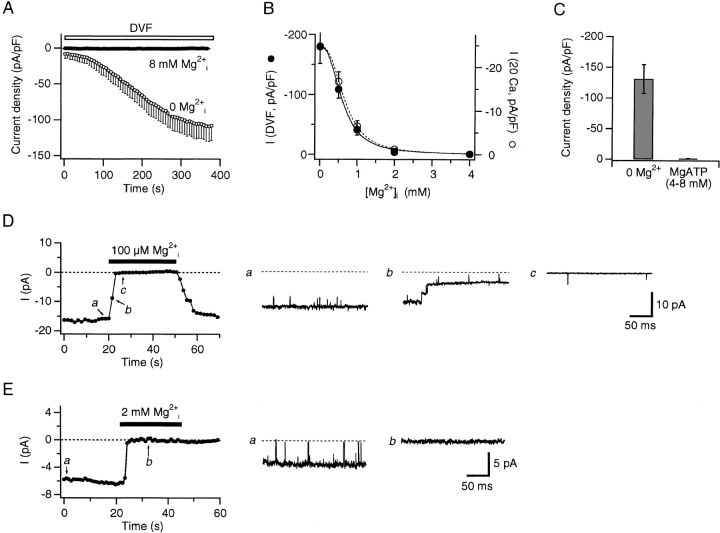
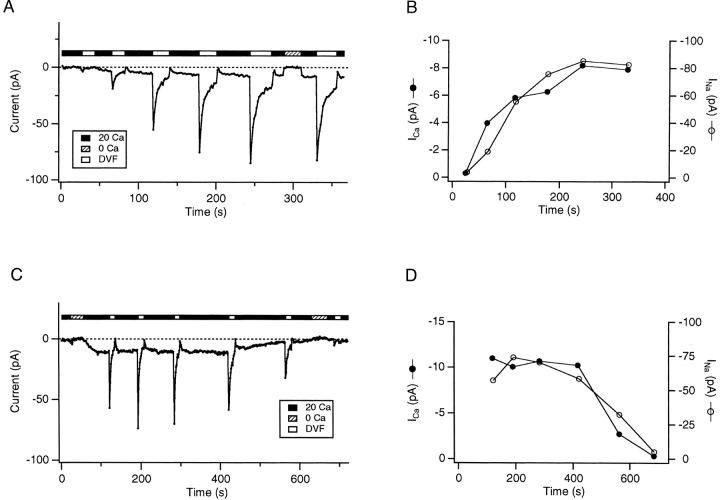
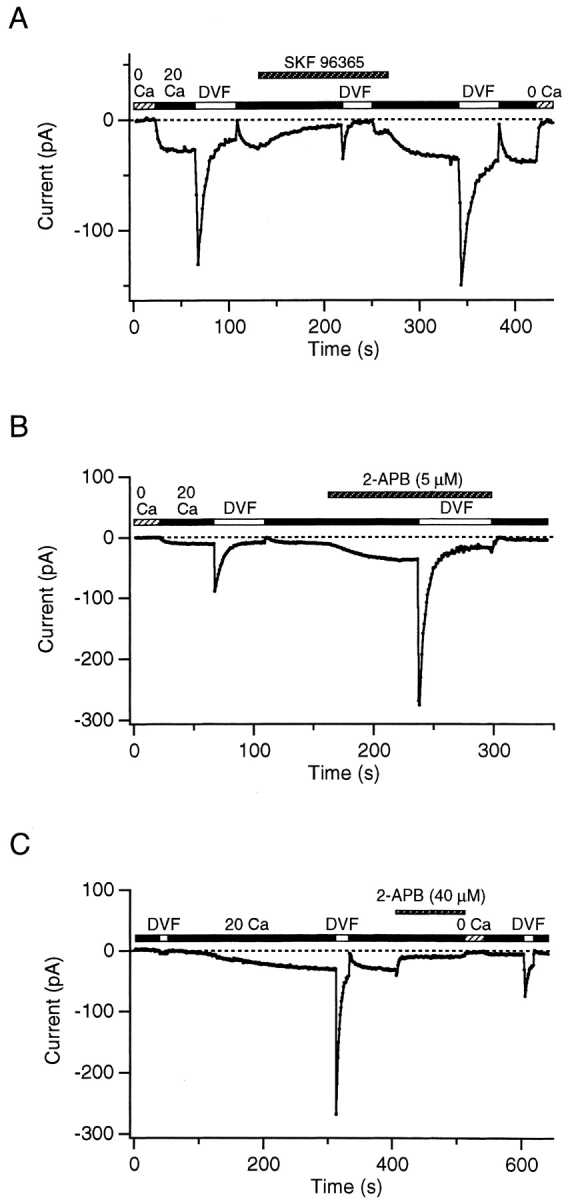
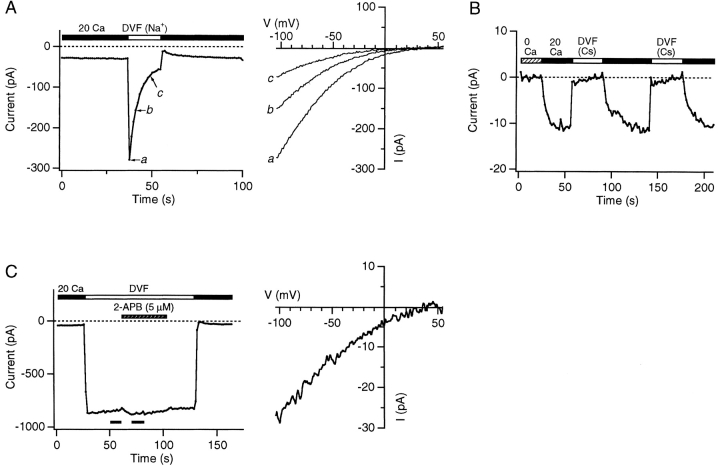
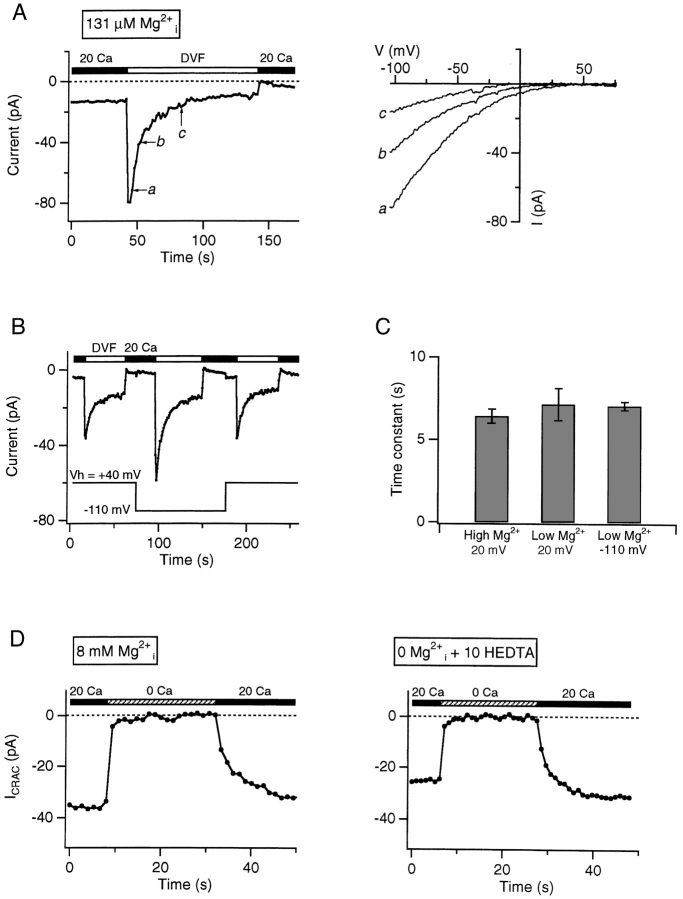
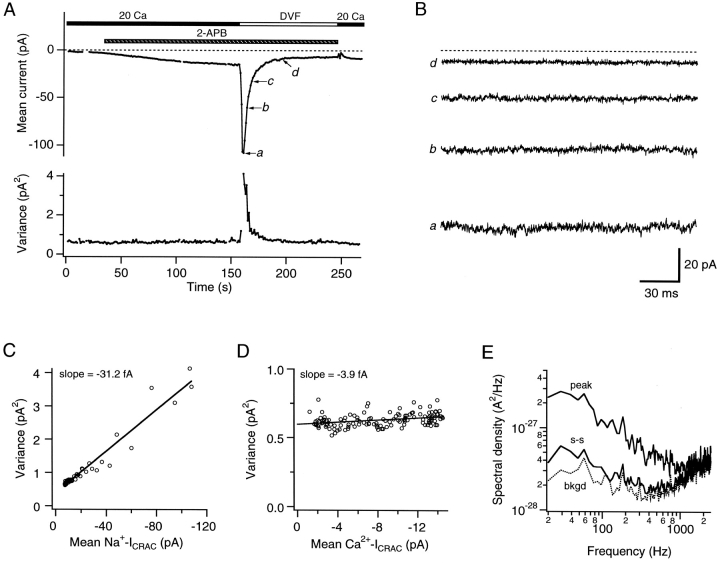
Although store-operated calcium release-activated Ca(2+) (CRAC) channels are highly Ca(2+)-selective under physiological ionic conditions, removal of extracellular divalent cations makes them freely permeable to monovalent cations. Several past studies have concluded that under these conditions CRAC channels conduct Na(+) and Cs(+) with a unitary conductance of approximately 40 pS, and that intracellular Mg(2+) modulates their activity and selectivity. These results have important implications for understanding ion permeation through CRAC channels and for screening potential CRAC channel genes. We find that the observed 40-pS channels are not CRAC channels, but are instead Mg(2+)-inhibited cation (MIC) channels that open as Mg(2+) is washed out of the cytosol. MIC channels differ from CRAC channels in several critical respects. Store depletion does not activate MIC channels, nor does store refilling deactivate them. Unlike CRAC channels, MIC channels are not blocked by SKF 96365, are not potentiated by low doses of 2-APB, and are less sensitive to block by high doses of the drug. By applying 8-10 mM intracellular Mg(2+) to inhibit MIC channels, we examined monovalent permeation through CRAC channels in isolation. A rapid switch from 20 mM Ca(2+) to divalent-free extracellular solution evokes Na(+) current through open CRAC channels (Na(+)-I(CRAC)) that is initially eightfold larger than the preceding Ca(2+) current and declines by approximately 80% over 20 s. Unlike MIC channels, CRAC channels are largely impermeable to Cs(+) (P(Cs)/P(Na) = 0.13 vs. 1.2 for MIC). Neither the decline in Na(+)-I(CRAC) nor its low Cs(+) permeability are affected by intracellular Mg(2+) (90 microM to 10 mM). Single openings of monovalent CRAC channels were not detectable in whole-cell recordings, but a unitary conductance of 0.2 pS was estimated from noise analysis. This new information about the selectivity, conductance, and regulation of CRAC channels forces a revision of the biophysical fingerprint of CRAC channels, and reveals intriguing similarities and differences in permeation mechanisms of voltage-gated and store-operated Ca(2+) channels.


Figures

F<sc>igure</sc> 7.
Figure 7.
Effects of extracellular divalent cations on MIC current. The cell was treated with 100 μM 2-APB for 15 min before seal formation to irreversibly inhibit ICRAC. Data are not corrected for leak current. Internal solution: MGF. Extracellular solution was alternated between 20 mM Ca2+ and DVF Ringer's as currents were measured in response to voltage ramps from −110 to 90 mV. (A) Parallel activation of inward Na+ current at −110 mV (measured in DVF Ringer's) and outward Cs+ current at 90 mV (measured in 20 mM Ca2+ o). (B) Ramp currents collected at the times shown by the open symbols in A. The similar activation time courses of the currents in 20 mM Ca2+ and DVF conditions (shown in A) suggest that the outwardly rectifying currents in 20 mM Ca2+ are due to MIC channels. (C) Removal of extracellular Ca2+ (2 mM Mg2+ o) does not alter the inward MIC current.
F<sc>igure</sc> 1.
Figure 1.
Activation of monovalent current in a Jurkat cell in the absence of extracellular divalent ions and intracellular Mg2+. (A) Time course and selectivity of the current developing in the presence of DVF extracellular solution. The bar indicates sequential changes in the bath solution from 20 mM Ca2+ Ringer's to Na+-DVF to NMDG-DVF (see materials and methods). Each point represents the mean current during 100-ms steps to −110 mV, after subtraction of the leak current recorded in 20 mM Ca2+ immediately after break-in (time = 0). Internal solution: Cs methanesulfonate/10 HEDTA/0 Mg2+ (MGF). (B) Current-voltage relationship from the cell in A recorded with Na+- or NMDG-based DVF extracellular solution. A 100-ms voltage ramp from −110 to 90 mV was applied. (C) Currents at −110 mV recorded at early times after break-in show progressive activation of single Na+-conducting channels. Channels appear to activate sequentially, opening to very high probabilities in an all-or-none fashion. Numbers on the left indicate time after whole-cell break-in; numbers on the right indicate multiples of −3.9 pA. Same experimental protocol as in A, from another cell. (D) Current-voltage relationship of single channels conducting monovalent ions in an inside-out patch. Same voltage protocol as in B. Bath solution: MGF. Pipette solution: Na+-DVF. (E) Single-channel currents at different potentials in an excised patch. Same conditions as in D. The closed level is indicated by the dashed lines.
F<sc>igure</sc> 2.
Figure 2.
Depletion of Ca2+ stores does not activate the large monovalent current. (A) Activation of Ca2+ and Na+ currents in a Jurkat cell treated with 1 μM TG for 5 min before seal formation. Current at −110 mV (corrected for leak current collected in 0 Ca2+ Ringer's) is plotted against time after break-in. As indicated by the bar, the extracellular solution was periodically switched between a 20 mM Ca2+ Ringer's and standard DVF solution to measure the Ca2+ and Na+ currents, respectively. (left graph) The Ca2+ current ICRAC is present at the time of break-in, and at these early times only a small transient Na+ current is seen under DVF conditions (arrow). Large currents outside the graph boundaries are omitted for clarity. (Right graph) The same experiment at lower gain shows the slow development of a large Na+ current in DVF solution following break-in. Internal solution: MGF. (B) Plot of the peak Ca2+ (•) and Na+ (○) currents measured during applications of 20 mM Ca2+ or DVF solutions, respectively. (C) Monovalent current-voltage relationships recorded under DVF conditions early (41 s; small transient current in A) and late (595 s; large sustained current in A) in the experiment. Note the changes in size, rectification, and reversal potential of the current with time. (D) Current-voltage relations recorded in the presence of 20 mM Ca2+ at early (37 s) and late (565 s) times. A large outwardly rectifying current develops with time. In C and D, the currents from the upper graphs are reproduced as dashed lines in the lower graphs for comparison.
F<sc>igure</sc> 3.
Figure 3.
ICRAC and the large monovalent current do not deactivate in parallel. (A) Following store depletion by passive dialysis with 1.2 mM EGTA, exposure to 20 mM Ca2+ evokes ICRAC, which progressively declines due to elevation of intracellular [Ca2+]i and refilling of Ca2+ stores. Current at −110 mV (corrected for leak current collected in 0 Ca2+ Ringer's) is plotted against time after break-in. Periodic exposure to DVF solution shows the development of the large monovalent current, shown at lower gain in the right graph. Note that ICRAC depotentiates during the second exposure to DVF (left), even though the Na+ current during that same period is fairly constant (right). Internal solution: Cs methanesulfonate/1.2 EGTA/0 Mg2+. (B) The Ca2+ (•) and Na+ currents (○) measured immediately before and during applications of the DVF solution in A. The monovalent current continues to increase as ICRAC deactivates.
F<sc>igure</sc> 4.
Figure 4.
ICRAC and the large monovalent current exhibit different sensitivities to SKF 96365. All cells were pretreated with 1 μM TG. In B and C, the recordings began after the monovalent current had activated to a steady-state level, as described in Fig. 2. Both currents were measured during steps to −110 mV. (A) Inhibition of ICRAC by SKF 96365 (20 μM). Inhibition and recovery followed exponential time courses with time constants of 17.5 and 19 s, respectively. Internal solution: Cs methanesulfonate/10 BAPTA/8 Mg2+. External: 20 mM Ca2+. (B) The large monovalent current is relatively insensitive to 20 μM SKF 96365. Internal solution: MGF. (C) Even after nearly complete inhibition of ICRAC by SKF 96365 (20 μM), removal of external divalent ions causes the monovalent current to rise rapidly to control levels. Thus, the insensitivity of the monovalent current to SKF 96365 is not explained by a failure to block CRAC channels under DVF conditions. Internal solution: MGF.
F<sc>igure</sc> 5.
Figure 5.
ICRAC and the large monovalent current have differing sensitivities to 2-APB. (A) A low concentration of 2-APB (5 μM) enhances ICRAC after full store depletion by TG. ICRAC is shown at −110 mV. Internal solution: Cs methanesulfonate/10 BAPTA/8 Mg2+. Holding potential: −40 mV (B) A high concentration of 2-APB (50 μM) initially enhances, then produces nearly complete and irreversible inhibition of ICRAC. Experimental conditions as described in A. (C) Effects of 2-APB on the large monovalent current. A high concentration (50 μM) inhibits the current partially and reversibly. In contrast, the irreversible inhibition of ICRAC in the same cell is shown by comparing currents during the first and second applications of Ca2+. 5 μM 2-APB fails to enhance the large monovalent current, although it enhances ICRAC as shown in A. Internal solution: MGF.
F<sc>igure</sc> 6.
Figure 6.
The large monovalent current is inhibited by intracellular Mg2+ and MgATP. (A) High intracellular [Mg2+] prevents activation of the large monovalent current. Mean currents at −110 mV in the presence of DVF Ringer's are shown as a function of time following break-in. Internal solution: Cs methanesulfonate containing either 10 HEDTA/0 Mg2+ (○; six cells) or 10 BAPTA/8 mM Mg2+ (•; four cells). (B) Dose-response curves for Mg2+-dependent inhibition of the inward Na+ current (•) recorded at −110 mV in DVF solution and the outward Cs+ current (○) at 90 mV in 20 mM Ca2+ o solution. The two extracellular solutions were periodically alternated as described in Fig. 2. Each point represents the mean ± SEM of 5–7 cells. The solid and dotted lines are fits of the equation I = 1/(1 + ([Mg2+]/K1/2)n) with the following parameter values: K1/2 = 0.6 mM and n = 2.4 for the inward current in DVF; K1/2 = 0.66 mM and n = 2.6 for the outward current in 20 mM Ca2+ o. Internal solution: Cs methanesulfonate/10 mM BAPTA containing indicated levels of calculated free Mg2+. (C) The large monovalent current is inhibited by intracellular MgATP. Shown are the mean whole-cell current amplitudes 400 s after break-in with internal solutions containing 4–8 mM MgATP (five cells) or 0 Mg2+/10 HEDTA (six cells), in experiments like the one shown in A. (D) Reversible inhibition of MIC channels by 100 μM Mg2+ i in excised patches. Channel activity persisted in this inside-out patch after excision into MGF solution. Application of 100 μM Mg2+ (free concentration, buffered with 10 mM HEDTA) to the cytoplasmic face resulted in reversible closure of two channels. The average current amplitudes during 250-ms steps to −115 mV are shown, with selected sweeps shown at higher time resolution to the right (dashed line indicates 0 current level). Pipette solution: Na-DVF. (E) 2 mM Mg2+ inhibits single-channel monovalent currents irreversibly. Same conditions as in D, except 2 mM Mg2+ was applied with 10 mM BAPTA.
F<sc>igure</sc> 8.
Figure 8.
Activation and deactivation of Ca2+ and Na+ currents through CRAC channels. Currents were measured during steps to −110 mV. (A) Activation of ICRAC and the transient Na+ current during passive store depletion with a pipette solution containing 10 mM BAPTA + 8 mM Mg2+. Periodic removal of external divalent ions reveals a transient monovalent current that increases in parallel with ICRAC. (B) The Ca2+ current (•) and the peak Na+ current (○) measured immediately before and during each application of DVF solution activate with similar kinetics. (C) Deactivation of ICRAC and the transient monovalent current during intracellular dialysis with 1 mM BAPTA + 8 mM Mg2+. As described in Fig. 3 A, ICRAC deactivates in the presence of low intracellular Ca2+ buffering, presumably due to store refilling. (D) The Ca2+ current (•) and the peak Na+ current (○) decline in parallel in the experiment in C. The similar activation and deactivation kinetics for the Na+ and Ca2+ currents support the idea that the transient monovalent current represents Na+ flux through CRAC channels.
F<sc>igure</sc> 9.
Figure 9.
Pharmacological evidence for monovalent currents through CRAC channels. ICRAC was activated by treatment with 1 μM TG for 5 min before seal formation (in A and B) or by passive depletion with 10 mM intracellular BAPTA (in C), with 10 mM intracellular Mg2+ to inhibit IMIC. (A) SKF 96365 (20 μM) inhibits both ICRAC and the transient monovalent current (under DVF conditions). Both currents recover following washout of the drug. (B) A low concentration of 2-APB (5 μM) enhances both ICRAC and the transient monovalent current by severalfold. (C) A high concentration of 2-APB (40 μM) significantly reduces both ICRAC and the transient monovalent current. The inhibition of both currents persists after washout of the drug.
F<sc>igure</sc> 10.
Figure 10.
CRAC channels have a low permeability to Cs+. ICRAC was activated by treatment with 1 μM TG, and measured in response to steps to −110 mV and ramps from −110 to 50 mV. (A) Positive reversal potential of monovalent CRAC current with Cs+ and Na+ as the primary intracellular and extracellular current carriers, respectively. Three ramp currents collected during the depotentiation of Na+-ICRAC (left graph) converge at ∼50 mV (right). (A and B) Internal solution: Cs methanesulfonate/10 BAPTA/8 Mg2+. (B) Extracellular Cs+ does not conduct significant inward current through CRAC channels under DVF conditions. When the bath solution is changed to a Cs+-based DVF solution, the current at −110 mV drops to ∼15% of its previous value in 20 mM Ca2+; in contrast, Na+-DVF causes an approximately eightfold increase in the current. Thus, Na+ is ∼50-fold more conductive than Cs+. (C) Measurement of the CRAC-channel current-voltage relation under DVF conditions in the absence of intracellular Mg2+. A low concentration of 2-APB (5 μM) induces an inward current that sums with IMIC. Ramp currents were averaged before and after 2-APB treatment (bars). Because 2-APB selectively enhances CRAC channel activity (Fig. 5), the difference between the two averaged currents isolates monovalent ICRAC (right). The net current reverses at ∼40 mV, indicating that the low Cs+ permeability of the CRAC channel is independent of intracellular Mg2+. Internal solution: MGF.
F<sc>igure</sc> 11.
Figure 11.
Intracellular Mg2+ is not involved in the depotentiation of CRAC channels following removal of extracellular Ca2+. ICRAC was activated by treatment with 1 μM TG, and currents were measured at a step potential of −110 mV. (A) Depotentiation of Na+-ICRAC occurs even in the presence of low cytoplasmic [Mg2+]. The pipette solution contained 8 mM MgATP to inhibit IMIC and 6 mM Na2ATP to reduce free [Mg2+] to 131 μM (calculated). Ramp currents collected at several times during the decline of Na+-ICRAC are shown at the right. (B) The kinetics of Na+-ICRAC decline are not voltage dependent. Transient Na+-ICRAC was evoked by exposure to DVF solution at a holding potential of 40 or −110 mV, with the same intracellular solutions as in A. The peak amplitude of Na+-ICRAC (measured during steps to −110 mV) is larger at the more negative holding potential, presumably due to the voltage dependence of CDP (see Zweifach and Lewis, 1996). However, the extent and rate of depotentiation are unaffected. (C) The rate of depotentiation is unaffected by the level of [Mg2+]i or membrane potential. Exponential curves were fitted to the depotentiation time course with 8 mM Mg2+ i at 20 mV (seven cells), 90–131 μM Mg2+ i at 20 mV (7 cells), or 131 μM Mg2+ at −110 mV holding potential (three cells). (D) Removal of intracellular Mg2+ does not affect CDP. After exposure to Ca2+-free conditions, readdition of extracellular Ca2+ causes ICRAC to reappear gradually over 10–20 s due to CDP. The extent and time course of CDP were similar in experiments with 8 mM Mg2+ i (left) or 0 Mg2+ i (right). Holding potential, 20 mV.
F<sc>igure</sc> 12.
Figure 12.
Fluctuation analysis of the Na+ current through CRAC channels. ICRAC was induced by treatment with 1 μM TG and was recorded at a constant holding potential of −110 mV. All data are from the same experiment. Internal solution: Cs methanesulfonate/10 BAPTA/8 Mg2+. (A) Mean value and variance of CRAC current in response to 2-APB (5 μM) and removal of divalent cations. Each point represents the values calculated from a 200-ms segment of current data. (B) Sample 200-ms segments of Na+-ICRAC as it depotentiates in the presence of DVF Ringer's. The zero-current level is indicated by the dashed line. (C) Mean-variance analysis of Na+-ICRAC. The plot shows the mean value and variance of 200-ms current sweeps collected as Na+-ICRAC depotentiated in the presence of DVF Ringer's. The data points are well fit by a line with a slope of −31.2 fA. (D) Mean-variance analysis of Ca+-ICRAC. The plot shows the mean value and variance of 200-ms current sweeps collected as Ca+-ICRAC was enhanced by 2-APB in 20 mM Ca2+ Ringer's. The data points are well fit by a line with a slope of −3.9 fA. (E) Spectral analysis of Na+-ICRAC. Spectra were collected and averaged in 0 Ca2+ + 2 μM Ni2+ (dotted trace, “bkgd”), and near the peak of the transient Na+ CRAC current (“peak”) and after Na+-ICRAC reached steady-state (“s-s”). Each trace is the average of 3–20 spectra. There is little power above background levels associated with Na+-ICRAC at frequencies >1 kHz.

Similar articles

Cited by

References

    1. Almers, W., and E.W. McCleskey. 1984. Non-selective conductance in calcium channels of frog muscle: calcium selectivity in a single-file pore. J. Physiol. 353:585–608. - PMC - PubMed
    1. Bakowski, D., and A.B. Parekh. 2002. Monovalent cation permeability and Ca2+ block of the store-operated Ca2+ current ICRAC in rat basophilic leukemia cells. Pflügers Arch. 443:892–902. - PubMed
    1. Braun, F.J., L.M. Broad, D.L. Armstrong, and J.W. Putney, Jr. 2001. Stable activation of single Ca2+ release-activated Ca2+ channels in divalent cation-free solutions. J. Biol. Chem. 276:1063–1070. - PubMed
    1. Broad, L.M., F.J. Braun, J.P. Lievremont, G.S. Bird, T. Kurosaki, and J.W. Putney, Jr. 2001. Role of the phospholipase C-inositol 1,4,5-trisphosphate pathway in calcium release-activated calcium current and capacitative calcium entry. J. Biol. Chem. 276:15945–15952. - PubMed
    1. Christian, E.P., K.T. Spence, J.A. Togo, P.G. Dargis, and E. Warawa. 1996. a. Extracellular site for econazole-mediated block of Ca2+ release-activated Ca2+ current (I crac) in T lymphocytes. Br. J. Pharmacol. 119:647–654. - PMC - PubMed

Publication types