. 2002 Apr 15;195(8):1023-32.
doi: 10.1084/jem.20012039.

HIV-1 Nef interacts with inositol trisphosphate receptor to activate calcium signaling in T cells

Affiliations

HIV-1 Nef interacts with inositol trisphosphate receptor to activate calcium signaling in T cells

Aki Manninen et al. J Exp Med. .

Abstract

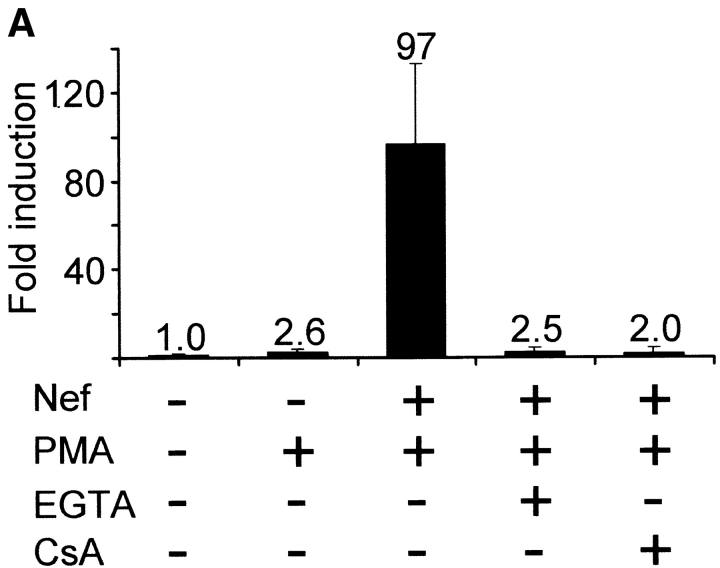
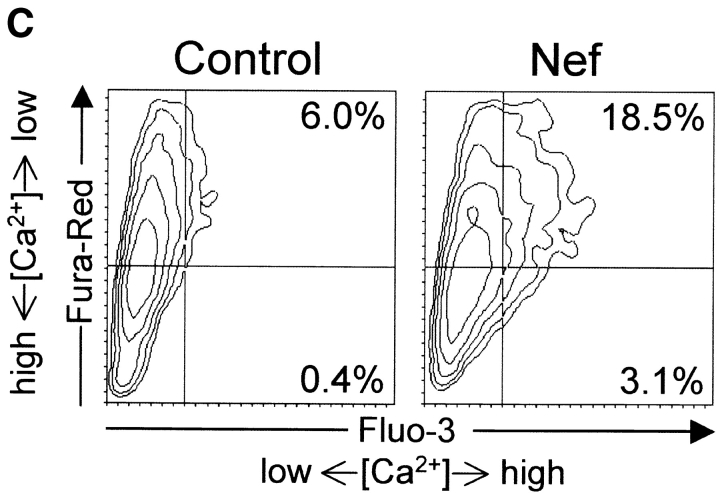
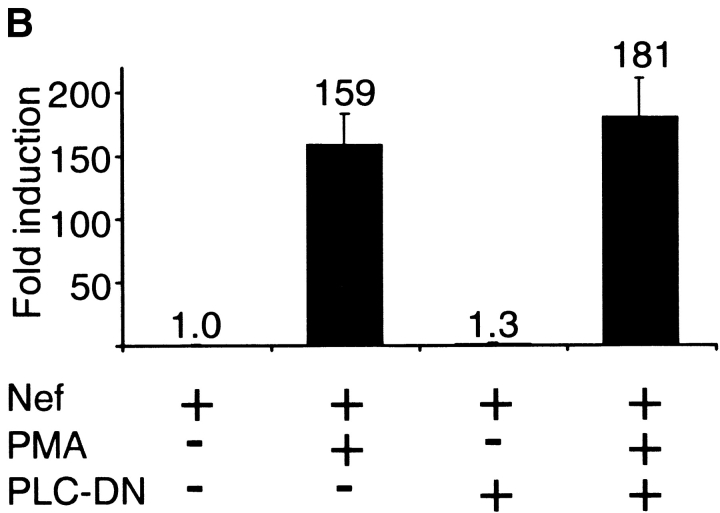
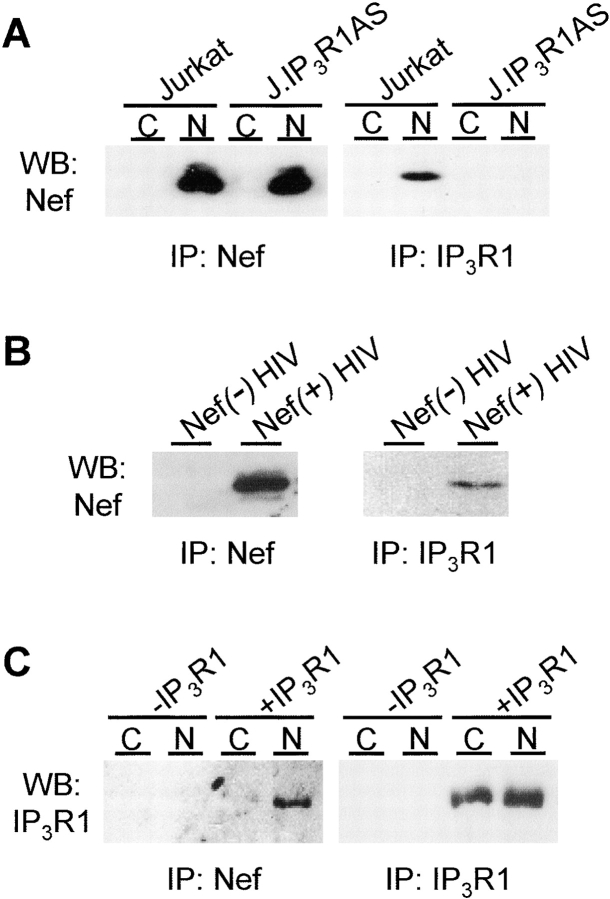
HIV-1 pathogenicity factor Nef has been shown to modulate calcium signaling in host cells, but the underlying molecular mechanisms have remained unclear. Here we show that calcium/calcineurin-dependent activation of nuclear factor of activated T cells (NFAT) by Nef in Jurkat T cells requires the endoplasmic reticulum-resident inositol trisphosphate receptor (IP(3)R), but yet does not involve increase in phospholipase-C gamma 1 (PLC gamma 1)-catalyzed production of IP(3) or depletion of IP(3)-regulated intracellular calcium stores. Nef could be coprecipitated with endogenous IP(3)R type-1 (IP(3)R1) from Nef-transfected Jurkat T cells as well as from HIV-infected primary human peripheral mononuclear cells. Thus, the Nef/IP(3)R1-interaction defines a novel T cell receptor-independent mechanism by which Nef can promote T cell activation, and appears to involve atypical IP(3)R-triggered activation of plasma membrane calcium influx channels in a manner that is uncoupled from depletion of intracellular calcium stores.


Figures

Figure 1.
Figure 1.
Calcium/calcineurin-dependent activation of NFAT by Nef. (A) Relative increase in NFAT-dependent luciferase expression in Jurkat cells cotransfected either with an empty control vector or Nef. 20 h later some of the cultures were pretreated with EGTA or CsA for 30 min before 4 h stimulation with PMA as indicated. Luciferase values normalized based on a cotransfected β-galactosidase vector are shown relative to the value from untreated control-transfected cells, which was set to one. The data are mean values from two independent transfection experiments performed in duplicate, and the standard error bars indicate variation among these four samples. (B) Fluorescence confocal microscopy of Jurkat cells transfected with a GFP-tagged NFATc1 together with an empty control vector or Nef. The percentages of cytoplasmic/nuclear localization of GFP-NFATc1 indicated represent data from three independent experiments in which a total of 70 GFP-positive cells from each sample were scored. (C) Flow cytometric analysis of intracellular calcium in control- or Nef-transfected Jurkat cells. Transfected Jurkat cells were enriched by panning and loaded with Ca2+-indicator dyes Fluo-3 and Fura-Red as described in Materials and Methods. Elevated Ca2+-levels enhance the Fluo-3 fluorescence but decrease the Fura-Red fluorescence. The data shown is representative of six independent transfection experiments.
Figure 1.
Figure 1.
Calcium/calcineurin-dependent activation of NFAT by Nef. (A) Relative increase in NFAT-dependent luciferase expression in Jurkat cells cotransfected either with an empty control vector or Nef. 20 h later some of the cultures were pretreated with EGTA or CsA for 30 min before 4 h stimulation with PMA as indicated. Luciferase values normalized based on a cotransfected β-galactosidase vector are shown relative to the value from untreated control-transfected cells, which was set to one. The data are mean values from two independent transfection experiments performed in duplicate, and the standard error bars indicate variation among these four samples. (B) Fluorescence confocal microscopy of Jurkat cells transfected with a GFP-tagged NFATc1 together with an empty control vector or Nef. The percentages of cytoplasmic/nuclear localization of GFP-NFATc1 indicated represent data from three independent experiments in which a total of 70 GFP-positive cells from each sample were scored. (C) Flow cytometric analysis of intracellular calcium in control- or Nef-transfected Jurkat cells. Transfected Jurkat cells were enriched by panning and loaded with Ca2+-indicator dyes Fluo-3 and Fura-Red as described in Materials and Methods. Elevated Ca2+-levels enhance the Fluo-3 fluorescence but decrease the Fura-Red fluorescence. The data shown is representative of six independent transfection experiments.
Figure 2.
Figure 2.
Effect of overexpression of a dominant-negative PLCγ1 mutant on NFAT activation by TCR-stimulation or Nef expression. (A) Jurkat cells were cotransfected with the NFAT reporter plasmid together with an empty control vector or a PLCγ1-H335F-expression plasmid (PLC-DN). 20 h after transfection cells were either left untreated or stimulated for 5 h with an anti-CD3 antibody (anti-CD3). Luciferase activities relative to the untreated control-transfected cells are expressed as in Fig. 1 A. (B) Relative NFAT activities in untreated or PMA-stimulated Jurkat cells transfected with Nef. An empty control vector or PLC-DN was cotransfected as indicated. These data represent mean values ± SE from five independent experiments.
Figure 2.
Figure 2.
Effect of overexpression of a dominant-negative PLCγ1 mutant on NFAT activation by TCR-stimulation or Nef expression. (A) Jurkat cells were cotransfected with the NFAT reporter plasmid together with an empty control vector or a PLCγ1-H335F-expression plasmid (PLC-DN). 20 h after transfection cells were either left untreated or stimulated for 5 h with an anti-CD3 antibody (anti-CD3). Luciferase activities relative to the untreated control-transfected cells are expressed as in Fig. 1 A. (B) Relative NFAT activities in untreated or PMA-stimulated Jurkat cells transfected with Nef. An empty control vector or PLC-DN was cotransfected as indicated. These data represent mean values ± SE from five independent experiments.
Figure 3.
Figure 3.
Dependence of NFAT activation by Nef on IP3R function. (A) Relative NFAT-dependent luciferase expression in Jurkat cells transfected with a control vector or Nef and stimulated with anti-CD3 antibodies or PMA. When indicated, 2-APB was added to the cultures 30 min before their stimulation. (B) Relative NFAT-dependent luciferase expression in IP3R1-deficient J.IP3R1AS cells transfected with a control vector or Nef and treated with the indicated activators (anti-CD3, PMA, and thapsigargin [TG]) as described in Materials and Methods. The data sets shown are representative of four (A) and seven (B) independent transfection experiments with similar results.
Figure 3.
Figure 3.
Dependence of NFAT activation by Nef on IP3R function. (A) Relative NFAT-dependent luciferase expression in Jurkat cells transfected with a control vector or Nef and stimulated with anti-CD3 antibodies or PMA. When indicated, 2-APB was added to the cultures 30 min before their stimulation. (B) Relative NFAT-dependent luciferase expression in IP3R1-deficient J.IP3R1AS cells transfected with a control vector or Nef and treated with the indicated activators (anti-CD3, PMA, and thapsigargin [TG]) as described in Materials and Methods. The data sets shown are representative of four (A) and seven (B) independent transfection experiments with similar results.
Figure 4.
Figure 4.
Coprecipitation of IP3R1 and Nef. (A) Control (C) and Nef-transfected (N) Jurkat and J.IP3R1AS cells were lysed and subjected to immunoprecipitations using antibodies for Nef (left panel) or IP3R1 (right panel) followed by analysis of the precipitated material by anti-Nef Western blotting. (B) PBMCs were infected with Nef-negative (Nef(−) HIV) or wild-type (Nef(−) HIV) HIV particles and subjected to anti-Nef (left panel) or anti-IP3R1 (right panel) immunoprecipitations as described above. The precipitated material was analyzed by anti-Nef Western blotting. (C) HEK293T fibroblasts were cotransfected with a control vector (C) or Nef (N) together with IP3R1 (+IP3R1) or an empty control plasmid (−IP3R1) as indicated. Cells were subjected to immunoprecipitations as described in 4A and the precipitated material was analyzed by anti-IP3R1 Western blotting.
Figure 5.
Figure 5.
Comparison of ionophore- and IP3-sensitive intracellular Ca2+-stores in control and in Nef-expressing cells. (A) Calcium released from ionophore-sensitive intracellular stores in Jurkat cells cotransfected with an apoaequorin vector together with a control vector (open squares) or Nef (black triangles) were measured based on luminescence by Ca2+/aequorin/coelenterazine complexes in these cells. A similar measurement of coelenterazine-loaded cells that were not transfected with apoaequorin is shown as a negative control (dotted line). EGTA and ionophore (Iono) were added to the cells during the course of the recordings as indicated. (B) Calcium released from IP3-sensitive stores in Jurkat cells transfected as in panel A, except that a vector for human muscarinic receptor-1 (hM1) was also included. EGTA and carbachol (CCh) were added to the cells during the course of the recordings as indicated. The mean values of quadruplicate samples are shown. These measurements were performed 5 (A) and 10 (B) times with similar results.

Similar articles

Cited by

References

    1. Piguet, V., and D. Trono. 1999. The Nef protein of primate lentiviruses. Rev. Med. Virol. 9:111–120. - PubMed
    1. Skowronski, J., M.E. Greenberg, M. Lock, R. Mariani, S. Salghetti, T. Swigut, and A.J. Iafrate. 1999. HIV and SIV Nef modulate signal transduction and protein sorting in T cells. Cold Spring Harb. Symp. Quant. Biol. 64:453–463. - PubMed
    1. Renkema, G.H., and K. Saksela. 2000. Interactions of HIV-1 Nef with cellular signal transducing proteins. Front. Biosci. 5:D268–D283. - PubMed
    1. Nabel, G., and D. Baltimore. 1987. An inducible transcription factor activates expression of human immunodeficiency virus in T cells. Nature. 326:711–713. - PubMed
    1. Stevenson, M., T.L. Stanwick, M.P. Dempsey, and C.A. Lamonica. 1990. HIV-1 replication is controlled at the level of T cell activation and proviral integration. EMBO J. 9:1551–1560. - PMC - PubMed

Publication types

MeSH terms