Expression and regulation of the PD-L1 immunoinhibitory molecule on microvascular endothelial cells
- PMID: 11932780
- PMCID: PMC3740166
- DOI: 10.1038/sj/mn/7800123
Expression and regulation of the PD-L1 immunoinhibitory molecule on microvascular endothelial cells
Abstract
Objective: To evaluate the expression and regulation of a novel B7-like protein, PD-L1, the ligand for the immunoinhibitory receptor PD-1 expressed on activated T-cells, on microvascular endothelial cells (ECs)
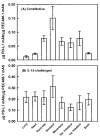
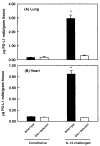
Methods: PD-L1 expression on ECs in vitro and in vivo was quantified by using a dual radiolabeled antibody technique after treatment with interferons (IFN) and IL-12, respectively. Changes in the level of PD-L1 mRNA were determined by using RT-PCR.
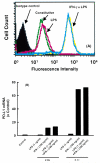
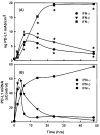
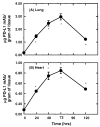
Results: PD-L1 was observed to be present on ECs under basal conditions. Treatment of ECs with IFN-alpha, -beta and -gamma, but not LPS, was observed to induce elevations in the mRNA and surface expression of PD-L1 on ECs. By using a dual radiolabeled monoclonal antibody (mAb) technique, PD-L1 expression in various tissues of control and IL-12 challenged wild-type and IFN-gamma-deficient mice was measured. A significant increase in PD-L1 expression was observed in tissues at 24 hours after IL-12-challenge, with peak levels of PD-L1 occurring 72 hours after IL-12 challenge. IL-12 was not effective at inducing PD-L1 expression in tissues of IFN-gamma-deficient mice.
Conclusions: These data show the expression of a novel B7-like molecule on murine ECs that is mediated by IFN-alpha, -beta, and -gamma, and suggest a potential pathway by which ECs may modulate T-cell function.
Figures


Similar articles
-
The PD-1/PD-L pathway is up-regulated during IL-12-induced suppression of EAE mediated by IFN-gamma.J Neuroimmunol. 2007 Apr;185(1-2):75-86. doi: 10.1016/j.jneuroim.2007.01.012. Epub 2007 Feb 23. J Neuroimmunol. 2007. PMID: 17320975 Free PMC article.
-
Endothelial expression of PD-L1 and PD-L2 down-regulates CD8+ T cell activation and cytolysis.Eur J Immunol. 2003 Nov;33(11):3117-26. doi: 10.1002/eji.200324270. Eur J Immunol. 2003. PMID: 14579280
-
Roles of programmed death-1 (PD-1)/PD-1 ligands pathway in the development of murine acute myocarditis caused by coxsackievirus B3.Cardiovasc Res. 2007 Jul 1;75(1):158-67. doi: 10.1016/j.cardiores.2007.03.012. Epub 2007 Mar 16. Cardiovasc Res. 2007. PMID: 17434153
-
Interferon-beta enhances monocyte and dendritic cell expression of B7-H1 (PD-L1), a strong inhibitor of autologous T-cell activation: relevance for the immune modulatory effect in multiple sclerosis.J Neuroimmunol. 2004 Oct;155(1-2):172-82. doi: 10.1016/j.jneuroim.2004.06.013. J Neuroimmunol. 2004. PMID: 15342209
-
PD-L1 partially protects renal tubular epithelial cells from the attack of CD8+ cytotoxic T cells.Nephrol Dial Transplant. 2007 Jun;22(6):1527-36. doi: 10.1093/ndt/gfl818. Epub 2007 Mar 5. Nephrol Dial Transplant. 2007. PMID: 17339272
Cited by
-
The Latest Look at PDT and Immune Checkpoints.Curr Issues Mol Biol. 2024 Jul 8;46(7):7239-7257. doi: 10.3390/cimb46070430. Curr Issues Mol Biol. 2024. PMID: 39057071 Free PMC article. Review.
-
Immune Escape Strategies in Head and Neck Cancer: Evade, Resist, Inhibit, Recruit.Cancers (Basel). 2024 Jan 11;16(2):312. doi: 10.3390/cancers16020312. Cancers (Basel). 2024. PMID: 38254801 Free PMC article. Review.
-
Immune checkpoint inhibitors for multiple myeloma immunotherapy.Exp Hematol Oncol. 2023 Nov 28;12(1):99. doi: 10.1186/s40164-023-00456-5. Exp Hematol Oncol. 2023. PMID: 38017516 Free PMC article. Review.
-
Molecular characterization of ferroptosis in soft tissue sarcoma constructs a prognostic and immunotherapeutic signature through experimental and bioinformatics analyses.Aging (Albany NY). 2023 Oct 20;15(20):11412-11447. doi: 10.18632/aging.205133. Epub 2023 Oct 20. Aging (Albany NY). 2023. PMID: 37874682 Free PMC article.
-
Prognostic Significance of Soluble PD-L1 on Cardiovascular Outcomes in Patients with Coronary Artery Disease.J Atheroscler Thromb. 2024 Apr 1;31(4):355-367. doi: 10.5551/jat.64183. Epub 2023 Oct 3. J Atheroscler Thromb. 2024. PMID: 37793811 Free PMC article.
References
-
- Billiau A, Heremans H, Vandekerckhove F, Dijkmans R, Sobis H, Meulepas E, Carton H. Enhancement of experimental allergic encephalomyelitis in mice by antibodies against IFN-gamma. J Immunol. 1988;140:1506–1510. - PubMed
-
- Briscoe DM, Henault LE, Geehan C, Alexander S, Lichtman AH. Human endothelial cell costimulation of T cell IFN-gamma production. J Immunol. 1997;159:3247–3256. - PubMed
-
- Dalton DK, Pitts-Meek S, Keshav S, Figari IS, Bradley A, Stewart TA. Multiple defects of immune cell function in mice with disrupted interferon-g genes. Science. 1993;259:1739–1742. - PubMed
-
- Duong TT, St Louis J, Gilbert JJ, Finkelman FD, Strejan GH. Effect of anti-interferon-gamma and anti-interleukin-2 monoclonal antibody treatment on the development of actively and passively induced experimental allergic encephalomyelitis in the SJL/J mouse. J Neuroimmunol. 1992;36:105–115. - PubMed
Publication types
MeSH terms
Substances
Grants and funding
LinkOut - more resources
Full Text Sources
Other Literature Sources
Research Materials

