An integrated physical and genetic map of the rice genome
- PMID: 11910002
- PMCID: PMC150577
- DOI: 10.1105/tpc.010485
An integrated physical and genetic map of the rice genome
Abstract
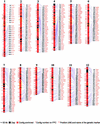
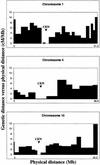
Rice was chosen as a model organism for genome sequencing because of its economic importance, small genome size, and syntenic relationship with other cereal species. We have constructed a bacterial artificial chromosome fingerprint-based physical map of the rice genome to facilitate the whole-genome sequencing of rice. Most of the rice genome ( approximately 90.6%) was anchored genetically by overgo hybridization, DNA gel blot hybridization, and in silico anchoring. Genome sequencing data also were integrated into the rice physical map. Comparison of the genetic and physical maps reveals that recombination is suppressed severely in centromeric regions as well as on the short arms of chromosomes 4 and 10. This integrated high-resolution physical map of the rice genome will greatly facilitate whole-genome sequencing by helping to identify a minimum tiling path of clones to sequence. Furthermore, the physical map will aid map-based cloning of agronomically important genes and will provide an important tool for the comparative analysis of grass genomes.
Figures


Comment in
-
Mapping and sequencing the rice genome.Plant Cell. 2002 Mar;14(3):521-3. doi: 10.1105/tpc.140310. Plant Cell. 2002. PMID: 11910000 Free PMC article. No abstract available.
Similar articles
-
A BAC-based physical map of Brachypodium distachyon and its comparative analysis with rice and wheat.BMC Genomics. 2009 Oct 27;10:496. doi: 10.1186/1471-2164-10-496. BMC Genomics. 2009. PMID: 19860896 Free PMC article.
-
A plant-transformation-competent BIBAC/BAC-based map of rice for functional analysis and genetic engineering of its genomic sequence.Genome. 2007 Mar;50(3):278-88. doi: 10.1139/g07-006. Genome. 2007. PMID: 17502901
-
Integration of hybridization-based markers (overgos) into physical maps for comparative and evolutionary explorations in the genus Oryza and in Sorghum.BMC Genomics. 2006 Aug 8;7:199. doi: 10.1186/1471-2164-7-199. BMC Genomics. 2006. PMID: 16895597 Free PMC article.
-
Physical mapping of the rice genome with YAC clones.Plant Mol Biol. 1997 Sep;35(1-2):101-13. Plant Mol Biol. 1997. PMID: 9291964 Review.
-
Genetic, physical, and informatics resources for maize. On the road to an integrated map.Plant Physiol. 2002 Dec;130(4):1598-605. doi: 10.1104/pp.012245. Plant Physiol. 2002. PMID: 12481043 Free PMC article. Review. No abstract available.
Cited by
-
Whole-genome validation of high-information-content fingerprinting.Plant Physiol. 2005 Sep;139(1):27-38. doi: 10.1104/pp.105.061978. Plant Physiol. 2005. PMID: 16166258 Free PMC article.
-
Fine genetic mapping of a gene required for Rice yellow mottle virus cell-to-cell movement.Theor Appl Genet. 2003 Jul;107(2):371-8. doi: 10.1007/s00122-003-1258-4. Epub 2003 Apr 5. Theor Appl Genet. 2003. PMID: 12679871
-
Estimation of gametic frequencies from F2 populations using the EM algorithm and its application in the analysis of crossover interference in rice.Theor Appl Genet. 2005 Jun;111(1):100-9. doi: 10.1007/s00122-005-1998-4. Epub 2005 Apr 20. Theor Appl Genet. 2005. PMID: 15841356
-
Transpositional behaviour of an Ac/Ds system for reverse genetics in rice.Theor Appl Genet. 2003 Dec;108(1):10-24. doi: 10.1007/s00122-003-1416-8. Epub 2003 Sep 25. Theor Appl Genet. 2003. PMID: 14513217
-
Mapping and sequencing the rice genome.Plant Cell. 2002 Mar;14(3):521-3. doi: 10.1105/tpc.140310. Plant Cell. 2002. PMID: 11910000 Free PMC article. No abstract available.
References
-
- Arumuganathan, K., and Earle, E.D. (1991). Nuclear DNA content of some important plant species. Plant Mol. Biol. Rep. 9, 208–218.
-
- Cheng, Z., Presting, G.G., Buell, C.R., Wing, R.A., and Jiang, J. (2001). High-resolution pachytene chromosome mapping of bacterial artificial chromosomes anchored by genetic markers reveals the centromere location and the distribution of genetic recombination along chromosome 10 of rice. Genetics 157, 1749–1757. - PMC - PubMed
Publication types
MeSH terms
Substances
LinkOut - more resources
Full Text Sources
Other Literature Sources

