

New insights into the pleiotropic drug resistance network from genome-wide characterization of the YRR1 transcription factor regulation system
- PMID: 11909958
- PMCID: PMC133742
- DOI: 10.1128/MCB.22.8.2642-2649.2002
New insights into the pleiotropic drug resistance network from genome-wide characterization of the YRR1 transcription factor regulation system
Abstract
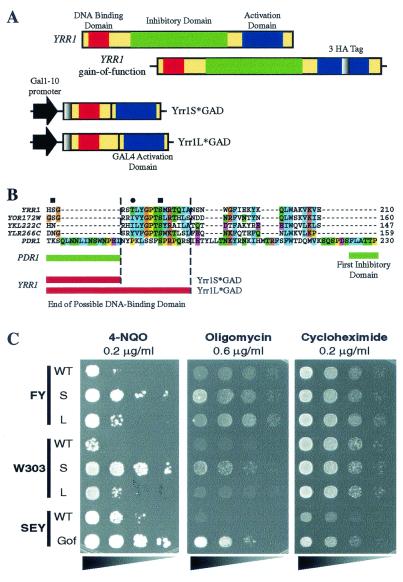
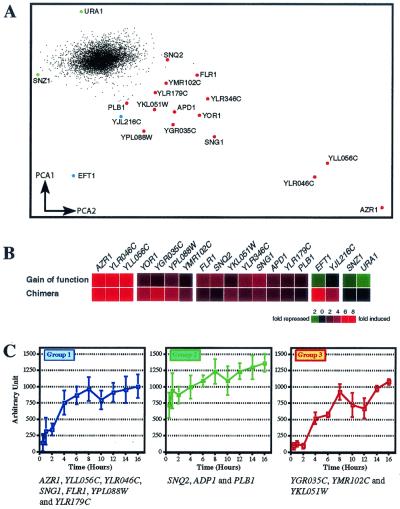
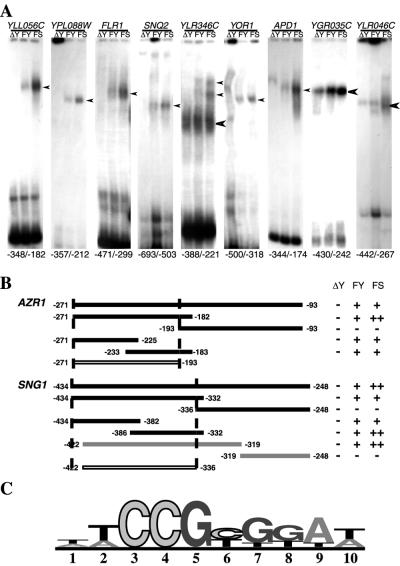
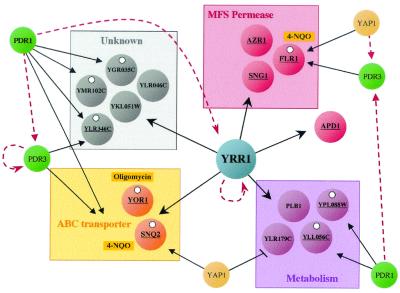
Yrr1p is a recently described Zn(2)Cys(6) transcription factor involved in the pleiotropic drug resistance (PDR) phenomenon. It is controlled in a Pdr1p-dependent manner and is autoregulated. We describe here a new genome-wide approach to characterization of the set of genes directly regulated by Yrr1p. We found that the time-course production of an artificial chimera protein containing the DNA-binding domain of Yrr1p activated the 15 genes that are also up-regulated by a gain-of-function mutant of Yrr1p. Gel mobility shift assays showed that the promoters of the genes AZR1, FLR1, SNG1, YLL056C, YLR346C, and YPL088W interacted with Yrr1p. The putative consensus Yrr1p binding site deduced from these experiments, (T/A)CCG(C/T)(G/T)(G/T)(A/T)(A/T), is strikingly similar to the PDR element binding site sequence recognized by Pdr1p and Pdr3p. The minor differences between these sequences are consistent with Yrr1p and Pdr1p and Pdr3p having different sets of target genes. According to these data, some target genes are directly regulated by Pdr1p and Pdr3p or by Yrr1p, whereas some genes are indirectly regulated by the activation of Yrr1p. Some genes, such as YOR1, SNQ2, and FLR1, are clearly directly controlled by both classes of transcription factor, suggesting an important role for the corresponding membrane proteins.
Figures
Similar articles
-
Cross-talk between transcriptional regulators of multidrug resistance in Saccharomyces cerevisiae.J Biol Chem. 2001 Mar 23;276(12):8812-9. doi: 10.1074/jbc.M010686200. Epub 2000 Dec 29. J Biol Chem. 2001. PMID: 11134057
-
Salicylic acid resistance is conferred by a novel YRR1 mutation in Saccharomyces cerevisiae.Biochem Biophys Res Commun. 2013 Apr 26;434(1):42-7. doi: 10.1016/j.bbrc.2013.03.069. Epub 2013 Mar 30. Biochem Biophys Res Commun. 2013. PMID: 23545261
-
Functional analysis of the promoter of the yeast SNQ2 gene encoding a multidrug resistance transporter that confers the resistance to 4-nitroquinoline N-oxide.Biosci Biotechnol Biochem. 1999 Jan;63(1):162-7. doi: 10.1271/bbb.63.162. Biosci Biotechnol Biochem. 1999. PMID: 10052137
-
The yeast zinc finger regulators Pdr1p and Pdr3p control pleiotropic drug resistance (PDR) as homo- and heterodimers in vivo.Mol Microbiol. 2002 Dec;46(5):1429-40. doi: 10.1046/j.1365-2958.2002.03262.x. Mol Microbiol. 2002. PMID: 12453227
-
Yeast gene YRR1, which is required for resistance to 4-nitroquinoline N-oxide, mediates transcriptional activation of the multidrug resistance transporter gene SNQ2.Mol Microbiol. 1998 Sep;29(5):1307-15. doi: 10.1046/j.1365-2958.1998.01027.x. Mol Microbiol. 1998. PMID: 9767597
Cited by
-
Efflux-mediated antifungal drug resistance.Clin Microbiol Rev. 2009 Apr;22(2):291-321, Table of Contents. doi: 10.1128/CMR.00051-08. Clin Microbiol Rev. 2009. PMID: 19366916 Free PMC article. Review.
-
Effect of 21 different nitrogen sources on global gene expression in the yeast Saccharomyces cerevisiae.Mol Cell Biol. 2007 Apr;27(8):3065-86. doi: 10.1128/MCB.01084-06. Epub 2007 Feb 16. Mol Cell Biol. 2007. PMID: 17308034 Free PMC article.
-
Association of ScV-LA Virus with Host Protein Metabolism Determined by Proteomics Analysis and Cognate RNA Sequencing.Viruses. 2022 Oct 25;14(11):2345. doi: 10.3390/v14112345. Viruses. 2022. PMID: 36366443 Free PMC article.
-
Unravel the regulatory mechanism of Yrr1p phosphorylation in response to vanillin stress in Saccharomyces cerevisiae.Microb Cell Fact. 2023 Mar 11;22(1):48. doi: 10.1186/s12934-023-02056-8. Microb Cell Fact. 2023. PMID: 36899374 Free PMC article.
-
YEASTRACT: an upgraded database for the analysis of transcription regulatory networks in Saccharomyces cerevisiae.Nucleic Acids Res. 2018 Jan 4;46(D1):D348-D353. doi: 10.1093/nar/gkx842. Nucleic Acids Res. 2018. PMID: 29036684 Free PMC article.
References
-
- Burns, N., B. Grimwade, P. B. Ross-Macdonald, E.-Y. Choi, K. Finberg, G. S. Roeder, and M. Snyder. 1994. Large-scale characterization of gene expression, protein localization and gene disruption in Saccharomyces cerevisiae. Genes Dev. 8:1087-1105. - PubMed
-
- Chauncey, T. R. 2001. Drug resistance mechanisms in acute leukemia. Curr. Opin. Oncol. 13:21-26. - PubMed
-
- Costanzo, M. C., M. E. Crawford, J. E. Hirschman, J. E. Kranz, P. Olsen, L. S. Robertson, M. S. Skrzypek, B. R. Braun, K. L. Hopkins, P. Kondu, C. Lengieza, J. E. Lew-Smith, M. Tillberg, and J. I. Garrels. 2001. YPD, PombePD and WormPD: model organism volumes of the BioKnowledge library, an integrated resource for protein information. Nucleic Acids Res. 29:75-79. - PMC - PubMed
-
- Cui, Z., D. Hirata, and T. Miyakawa. 1999. Functional analysis of the promoter of the yeast SNQ2 gene encoding a multidrug resistance transporter that confers the resistance to 4-nitroquinoline N-oxide. Biosci. Biotechnol. Biochem. 63:162-167. - PubMed
-
- Cui, Z., T. Shiraki, D. Hirata, and T. Miyakawa. 1998. Yeast gene YRR1, which is required for resistance to 4-nitroquinoline N-oxide, mediates transcriptional activation of the multidrug resistance transporter gene SNQ2. Mol. Microbiol. 29:1307-1315. - PubMed
Publication types
MeSH terms
Substances
Grants and funding
LinkOut - more resources
Full Text Sources
Other Literature Sources
Molecular Biology Databases