. 2002 Mar 1;22(5):1608-17.
doi: 10.1523/JNEUROSCI.22-05-01608.2002.

Fast vesicle recycling supports neurotransmission during sustained stimulation at hippocampal synapses

Affiliations

Fast vesicle recycling supports neurotransmission during sustained stimulation at hippocampal synapses

Yildirim Sara et al. J Neurosci. .

Abstract

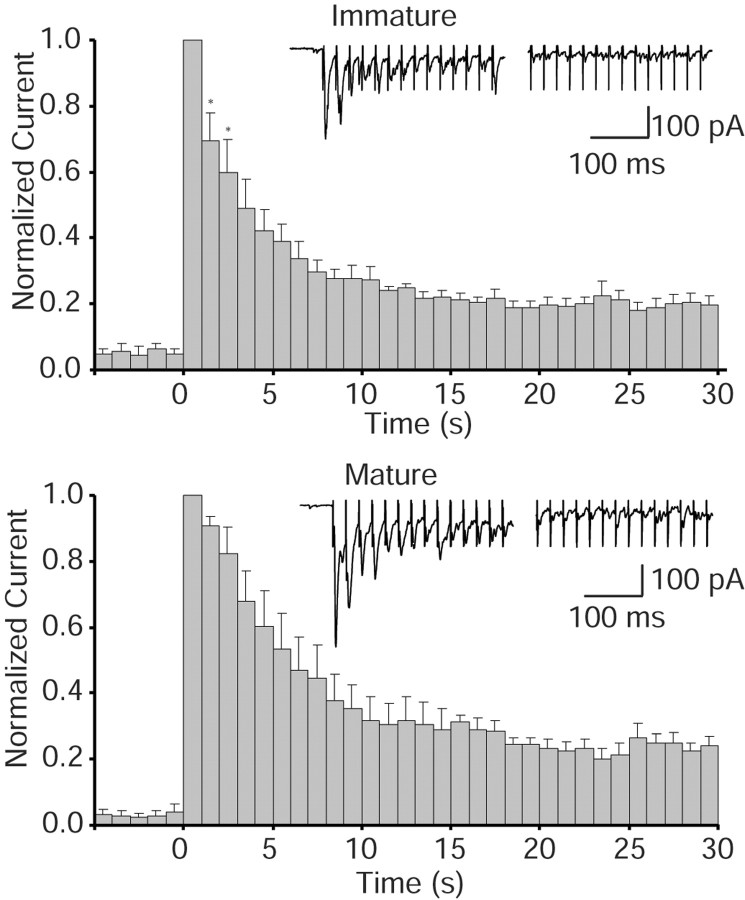
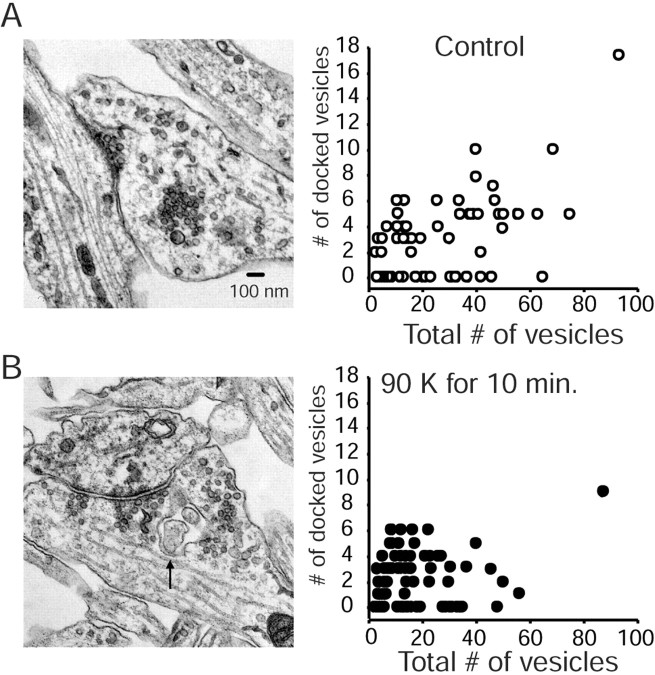
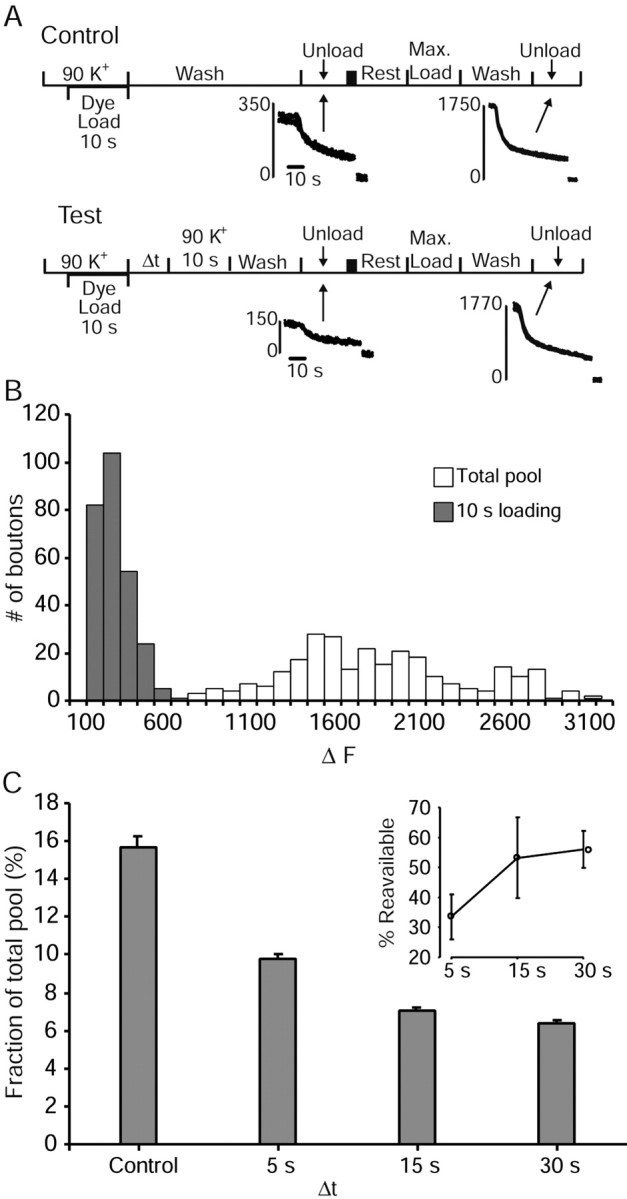
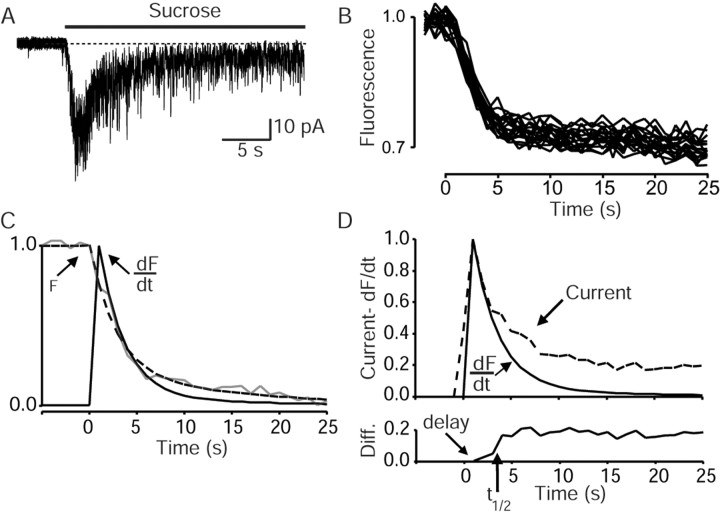
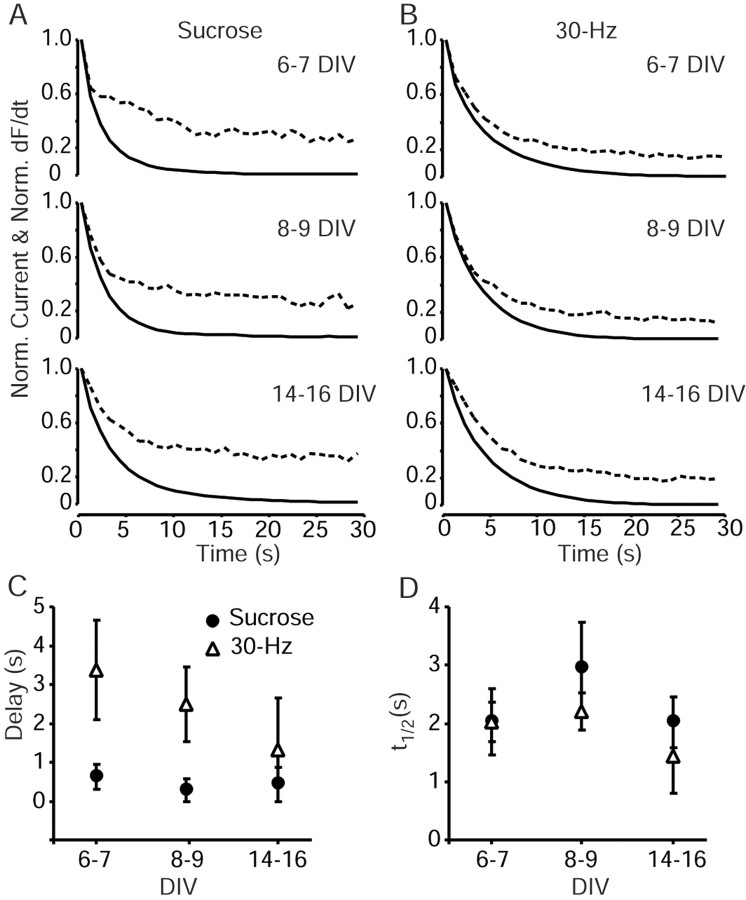
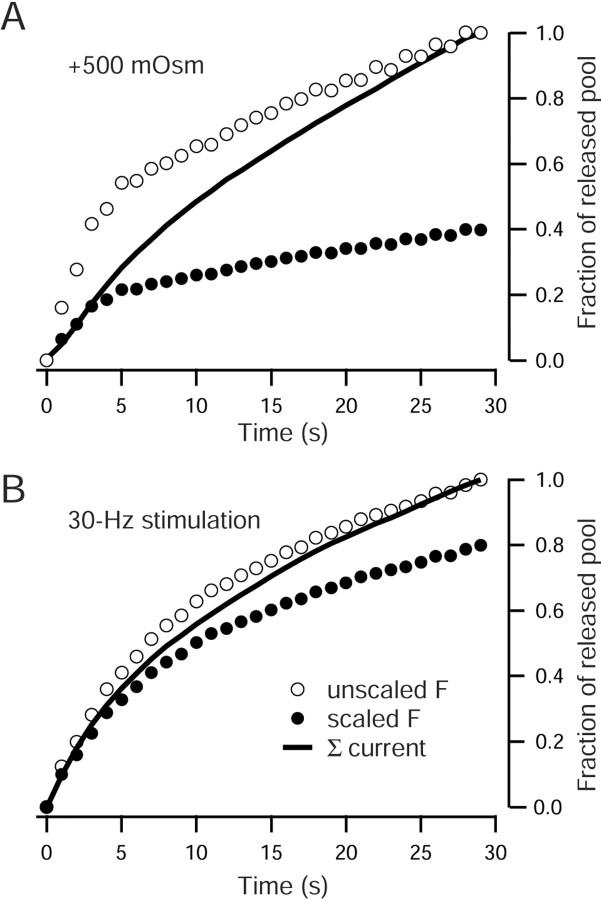
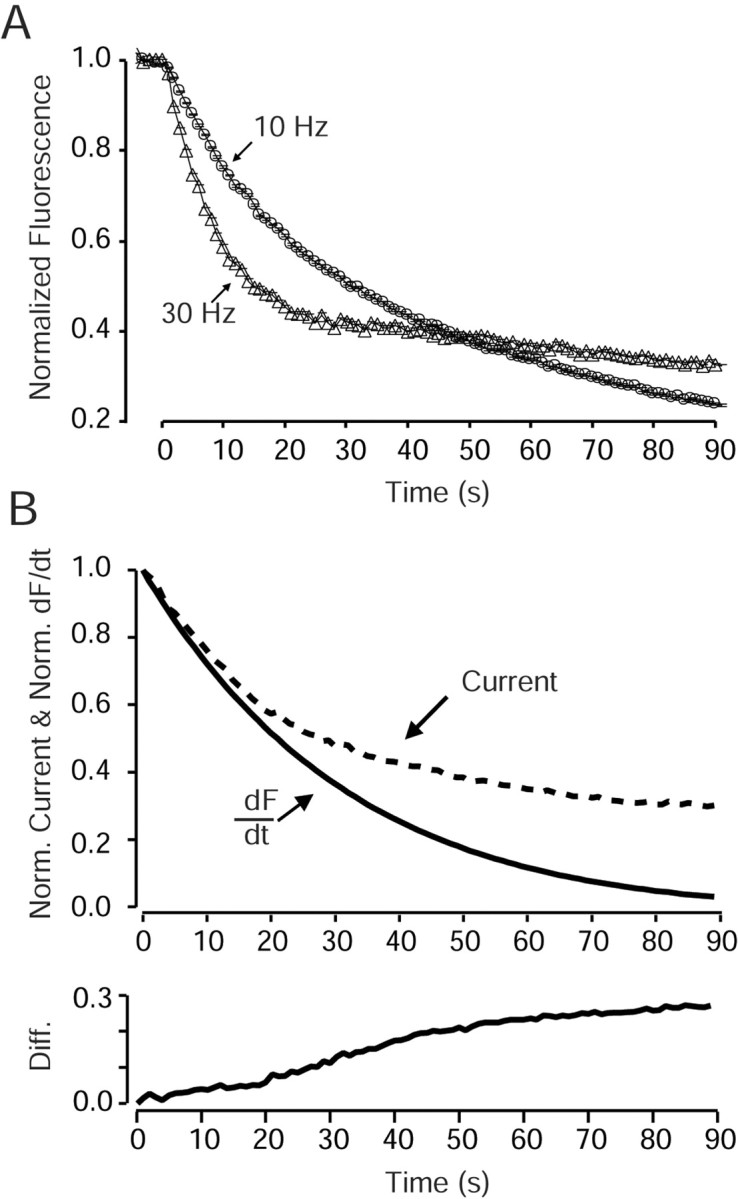
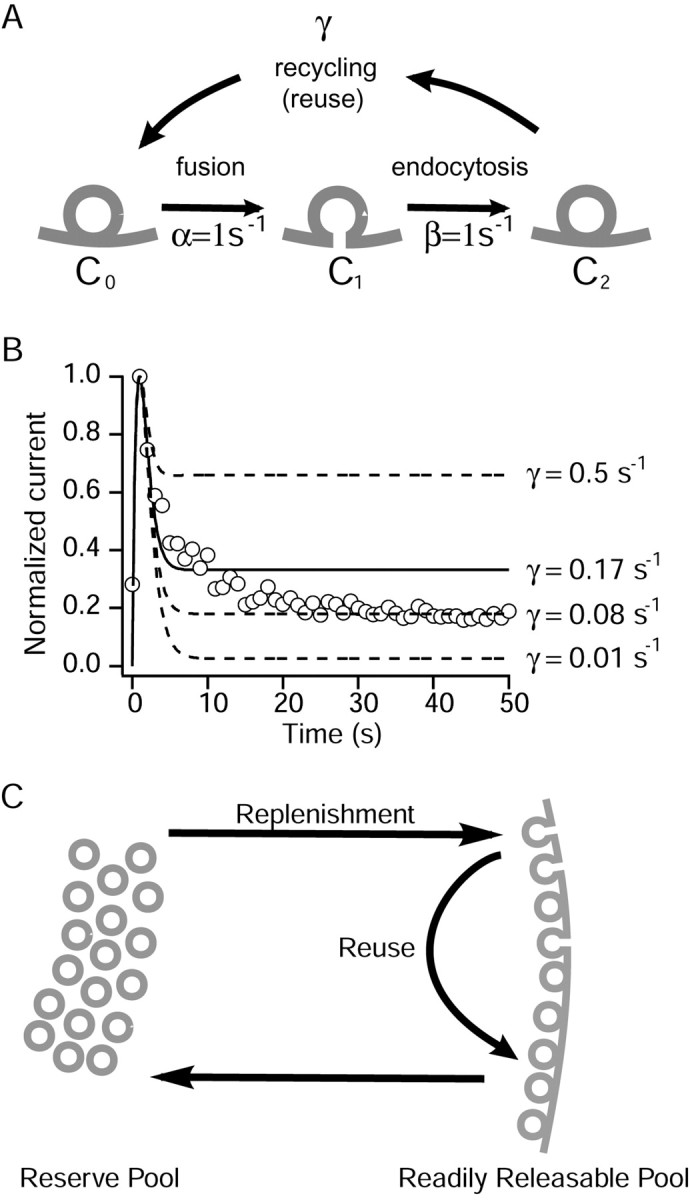
High-frequency induced short-term synaptic depression is a common feature of central synapses in which synaptic responses rapidly decrease to a sustained level. A limitation in the availability of release-ready vesicles is thought to be a major factor underlying this phenomenon. Here, we studied the kinetics of vesicle reavailability and reuse during synaptic depression at hippocampal synapses. High-intensity stimulation of neurotransmitter release was induced by hyperosmolarity, high potassium, or action potential firing at 30 Hz to produce synaptic depression. Under these conditions, synaptic transmission rapidly depressed to a plateau level that was typically 10-40% of the initial response and persisted at this level for at least 5 min regardless of the developmental stage of synapses. This nondeclining phase of transmission was partly sustained by fast recycling and reuse of synaptic vesicles even after minutes of stimulation. Simultaneous electrical recording of postsynaptic responses and styryl dye destaining showed that after an initial round of exocytosis, vesicles were available for reuse with a delay between 1 and 3 sec during 30 Hz action potential or hypertonicity-induced stimulation. During these stimulation paradigms, there was a limited mobilization of vesicles from the reserve pool. During 10 Hz stimulation, however, the extent of vesicle reuse was minimal during the first 20 sec. These results suggest a role for fast vesicle recycling as a functional homeostatic mechanism that prevents vesicle depletion and maintains synaptic responses in the face of intense stimulation.


Figures

Fig. 1.
Fig. 1.
Prolonged high-potassium or hypertonic sucrose solution application gives rise to sustained neurotransmission throughout synapse maturation. A, B, During whole-cell recordings introduction of hypertonic (+500 mOsm) solution initiated transmitter release with a peak response followed by a prominent plateau in immature (6–7 div) and mature (14–16 div) cultures (n = 6 each). Plots show average normalized current transfer integrated over 1 sec intervals. Exampletraces are depicted in the insets.C, D, K+ (90 mm)stimulation caused rapid depolarization and synaptic activity (n = 6). We isolated the amount of synaptic activity from the nonsynaptic current influx by subtracting the baseline current after blockade of postsynaptic receptors by 2,3-dihydroxy-6-nitro-7-sulfonyl-benzo[f]quinoxaline (NBQX) (10 μm) and AP-5 (50 μm) during a subsequent application of high-K+ solution with the same duration. This baseline typically corresponds to the level indicated by thedashed line in C. The effect of glutamate receptor inhibitors during plateau is shown in theinset. All symbols show mean values ± SEM.
Fig. 2.
Fig. 2.
Time course of synaptic responses to sustained 30 Hz stimulation. The synaptic activity evoked by the 30 Hz field stimulation (30 sec) was monitored in immature (top;n = 9) and mature (bottom;n = 8) cultures. Young synapses displayed faster depression kinetics in the first 2 sec of stimulation compared with the mature synapses. *Statistical difference at p < 0.05. Each bar of the graph represents total current integrated over 1 sec intervals of field stimulation and normalized with respect to the maximum. Insets, Evoked synaptic currents by the first and last 14 pulses during 30 sec application of 30 Hz stimulation.
Fig. 3.
Fig. 3.
Prolonged high-K+ stimulation caused minimal changes in the numbers of vesicles and synapse morphology. A, B, Example electronmicrographs illustrate the vesicle organization of synapses from cultures treated with 4 mm K+ (A) and 90 mm K+ (B) for 10 min. Right panels, Cumulative data plotted as the number of morphologically docked vesicles versus the total number of vesicles in synapses treated with 4 mm K+(n = 63 boutons) or 90 mmK+ for 10 min (n = 87 boutons). The arrow in B points to one of the endosomal structures that were abundant after prolonged 90 mm K+ stimulation.
Fig. 4.
Fig. 4.
Time course of vesicle recycling during sustained high-K+ stimulation. A, Synapses treated with 90 mm K+ for 5 min were loaded with FM 2-10 during the last 10 sec of this challenge. The extent of loading achieved by this protocol was determined by measuring the amount of dye unloaded with repeated 90 mmK+ application after 5 min of washout (n = 5; 271 boutons). To determine the time course of vesicle reavailability, a brief (10 sec) 90 mmK+ challenge was interspersed after a delay (Δt) after dye loading. In three different sets of experiments, a 90 mm K+ test was applied with a delay of 5 sec (n = 7; 368 boutons), 15 sec (n = 4; 271 boutons), or 30 sec (n = 4; 213 boutons), respectively. At the end of the washout period, each trial was evaluated for the remaining FM2-10 staining. After each experiment, we executed a maximal dye loading and unloading paradigm to determine the total pool size and normalize the data according to this value. B, Histogram of fluorescence intensity distributions in fatigued synapses labeled with the 10 sec staining protocol and total pool size as determined by maximal FM2-10 staining in controls. C, After 90 mm K+ application for 5 min, up to 15% of total pool could be stained with FM2-10 (Control). Brief interspersed high-K+ challenges partially unloaded the synapses. This fluorescence decrease was first detected at 5 sec after loading and decreased further with increasing delay indicating that more recycled vesicles became available for release.Inset, Percentage of vesicles reavailable with respect to the delay after initial dye uptake (i.e., the difference between fluorescence detected after 5, 15, and 30 sec stimulations and control).
Fig. 5.
Fig. 5.
Evaluation of sucrose-induced release by simultaneous electrical recordings and fluorescence destaining.A, B, Whole-cell electrical recording of a sucrose response (A) and its instantaneous fluorescence counterpart from multiple boutons on the same neuron (B). C, Average fluorescence response (F, gray line) was smoothed by curve fitting (dashed line) to reduce noise, which in turn helped obtain a smooth derivative of the fluorescence signal (dF/dt, solid line). D, The difference between the rate of dye release and synaptic activity was assessed after alignment of the dF/dt and Current plots with respect to their peaks. Current plot was obtained by integrating current within 1 sec intervals. The difference shown in thebottom graph was interpreted as the time course of vesicle reuse.
Fig. 6.
Fig. 6.
Conservation of fast vesicle recycling during synapse maturation. A, B, Comparison of kinetics of dye loss and electrophysiological recordings show that the plateau level of neurotransmitter release cannot be accounted for by styryl dye destaining. This difference between the two modes of measurement was present throughout synapse maturation in response sucrose (A) as well as 30 Hz stimulation (B). C, Average time delay before the initial appearance of the difference between two signals during sucrose (closed circles) and 30 Hz stimulation (open triangles). D, Rise times (t½) of this difference varied between 2 and 3 sec during in vitro development [30 Hz stimulation, n = 9 (6–7 div),n = 9 (8–9 div), n = 8 (14–16 div); sucrose, n = 8 (6–7 div),n = 8 (8–9 div), n = 9 (14–16 div)]. All symbols denote mean values ± SEM.
Fig. 7.
Fig. 7.
Estimation of the extent of vesicle pool turnover during stimulation. A, B, Comparison of the cumulative integral of synaptic current (dark line) to kinetics of fluorescence loss from FM2-10-loaded synapses in mature cultures (8–16 div). Open circles represent average destaining kinetics scaled with the assumption that both electrophysiological and optical readout of exocytosis originate from the same pool of vesicles. Note the apparent mismatch between the curves. When the fluorescence trace was scaled to fit the first 2 sec of neurotransmitter release, the resulting curve (closed circles) revealed a significant difference between the extent of vesicle pool mobilization and neurotransmitter release. The same analysis was performed for hypertonic sucrose stimulation (A) and 30 Hz field stimulation (B). The relative amount of vesicle reuse is larger during hypertonic sucrose stimulation. However, it should be noted that 30 Hz stimulation overall mobilizes a larger percentage of the total pool compared with sucrose.
Fig. 8.
Fig. 8.
Vesicle mobilization during 10 Hz stimulation.A, In contrast to the biphasic nature of fluorescence loss during 30 Hz stimulation (n = 4; 288 boutons), in which a fast drop of fluorescence was accompanied by a slow decline, 10 Hz resulted in monophasic fluorescence loss (n = 6; 431 boutons). The two destaining patterns crossed each other after 50 sec. B, Analysis of average release kinetics acquired through whole-cell recordings (n = 10) and styryl dye destaining induced by 10 Hz stimulation. Analysis was performed as described in Figure 5. The difference between dF/dt andCurrent traces became gradually more significant after 20 sec of stimulation. After this point, transmitter release reached to a plateau level, whereas dye release continued to decrease.Bottom graph, Difference between the two traces indicating the time course of vesicle reuse.
Fig. 9.
Fig. 9.
The estimated time frame of vesicle reuse can account for the sustained phase of synaptic activity. A, Three-compartmental model where vesicles sequentially move between compartments C0,C1, and C2connected with rate constants α, β, and γ, respectively. The observable output of the model is detected as the fused stateC1 by simultaneous solution of the equations: dC0/dt= −α C0 + γC2,dC1/dt = αC0 − βC1, anddC2/dt = βC1 − γC2 where α = β = 1/sec.B, Correspondence between results of the simulation described in A (lines) and average data obtained from prolonged sucrose applications (open circles). Solid line, Time course of vesicles moving through the fused state (C1) when γ = 0.17/sec (τreuse = 5.8 sec), which effectively describes the first 15 sec of sucrose response.Dashed lines, Estimations for distinct values of γ. γ = 0.08/sec can account for the response at the end of sucrose application. C, Simple scheme depicting the organization of functionally distinct vesicle pools and the routes of vesicle replenishment and reuse.

Similar articles

Cited by

References

    1. Betz WJ, Bewick GS. Optical monitoring of transmitter release and synaptic vesicle recycling at the frog neuromuscular junction. J Physiol (Lond) 1993;460:287–309. - PMC - PubMed
    1. Bolshakov VY, Siegelbaum SA. Regulation of hippocampal transmitter release during development and long-term potentiation. Science. 1995;269:1730–1734. - PubMed
    1. Ceccarelli B, Hurlbut WP, Mauro A. Turnover of transmitter and synaptic vesicles at the frog neuromuscular junction. J Cell Biol. 1973;57:499–524. - PMC - PubMed
    1. Choi S, Lovinger DM. Decreased probability of neurotransmitter release underlies striatal long-term depression and postnatal development of corticostriatal synapses. Proc Natl Acad Sci USA. 1997;94:2665–2670. - PMC - PubMed
    1. Delaney K, Tank DW, Zucker RS. Presynaptic calcium and serotonin-mediated enhancement of transmitter release at crayfish neuromuscular junction. J Neurosci. 1991;11:2631–2643. - PMC - PubMed

Publication types

MeSH terms

LinkOut - more resources