. 2002 Feb 18;195(4):423-35.
doi: 10.1084/jem.20010032.

Tumor growth enhances cross-presentation leading to limited T cell activation without tolerance

Affiliations

Tumor growth enhances cross-presentation leading to limited T cell activation without tolerance

Linh T Nguyen et al. J Exp Med. .

Abstract

Using a tumor model of spontaneously arising insulinomas expressing a defined tumor-associated antigen, we investigated whether tumor growth promotes cross-presentation and tolerance of tumor-specific T cells. We found that an advanced tumor burden enhanced cross-presentation of tumor-associated antigens to high avidity tumor-specific T cells, inducing T cell proliferation and limited effector function in vivo. However, contrary to other models, tumor-specific T cells were not tolerized despite a high tumor burden. In fact, in tumor-bearing mice, persistence and responsiveness of adoptively transferred tumor-specific T cells were enhanced. Accordingly, a potent T cell-mediated antitumor response could be elicited by intravenous administration of tumor-derived peptide and agonistic anti-CD40 antibody or viral immunization and reimmunization. Thus, in this model, tumor growth promotes activation of high avidity tumor-specific T cells instead of tolerance. Therefore, the host remains responsive to T cell immunotherapy.


Figures

Figure 1.
Figure 1.
P14 TCR transgenic T cells have high avidity for LCMV-GP33. Splenocytes from naive P14 transgenic mice (black symbols) and C57Bl/6 mice 8 d after infection with 2,000 PFU LCMV Armstrong (white symbols) were stained with anti-CD8α Ab and the indicated dilutions of H-2Db/GP33 tetramer. Mean fluorescence intensities (MFI) of CD8+ T cells representative of 3–4 mice per group from two independent experiments are shown.
Figure 2.
Figure 2.
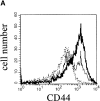
Enhanced upregulation of CD44 on tumor-specific T cells in the PDLNs. Lymphocytes from the PDLNs, NDLNs, and spleens of P14, P14/RIP-GP, and tumor-bearing P14/RIP-Tag2 and P14/RIP(GP-Tag2) mice were gated on Vα2+ cells, and the percentage of CD44high was determined. (A) Representative CD44 profiles of Vα2+ PDLN cells are shown from P14 (dashed line), P14/RIP-GP (thin line), and P14/RIP(GP × Tag2) (thick line) mice. (B) Data shown are the mean and standard error of 3–7 mice per genotype.
Figure 2.
Figure 2.
Enhanced upregulation of CD44 on tumor-specific T cells in the PDLNs. Lymphocytes from the PDLNs, NDLNs, and spleens of P14, P14/RIP-GP, and tumor-bearing P14/RIP-Tag2 and P14/RIP(GP-Tag2) mice were gated on Vα2+ cells, and the percentage of CD44high was determined. (A) Representative CD44 profiles of Vα2+ PDLN cells are shown from P14 (dashed line), P14/RIP-GP (thin line), and P14/RIP(GP × Tag2) (thick line) mice. (B) Data shown are the mean and standard error of 3–7 mice per genotype.
Figure 3.
Figure 3.
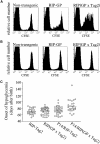
The LCMV-GP is cross-presented in the PDLNs. Bone-marrow cells from P14/b (top) or P14/bm13 (bottom) mice were transferred into lethally irradiated RIP-GP and RIP(GP × Tag2) recipients. Representative CD69 profiles (gated on Vα2+CD8+ cells) are shown for PDLNs and NDLNs from recipients 6 wk after transfer. Results are representative of 2–9 mice per group from three independent experiments.
Figure 4.
Figure 4.
Spontaneous induction of proliferation and effector function of tumor-specific T cells. (A and B) CFSE-labeled, naive P14 transgenic T cells were adoptively transferred into nontransgenic, RIP-GP, or tumor-bearing RIP(GP × Tag2) hosts. 72 h later, lymphocytes from PDLNs (A) and NDLNs (B) were gated on Vα2+ lymphocytes and CFSE profiles determined. Profiles are representative of 5–7 mice from each genotype, from three independent experiments. (C) The age at which blood glucose levels dropped to or below 5 mM was recorded for RIP-Tag2, RIP(GP × Tag2), P14/RIP-Tag2, and P14/RIP(GP × Tag2) mice. Individual mouse data are shown, the horizontal bar indicates the mean onset of hypoglycemia.
Figure 5.
Figure 5.
No significant tolerance induction of tumor-specific T cells in P14/RIP(GP × Tag2) mice. (A) Deletion was assessed by isolating PDLNs, NDLNs, and spleens from P14, P14/RIP-GP, tumor-bearing P14/RIP-Tag2, and P14/RIP(GP × Tag2) mice. The percentage of P14 transgenic was determined by the percentage of Vα2+ of lymphocytes by flow cytometric analysis. Data shown are the mean and standard deviation of 3–7 mice per genotype. (B and C) Anergy was assessed by proliferation assay of PDLN cells (B) and NDLN cells (C). Lymph node cells were incubated with C57Bl/6 spleen cell stimulators prepulsed with 10−7 M GP33 or negative control peptide AV. Data shown are from two mice per genotype, and results are representative of four experiments.
Figure 5.
Figure 5.
No significant tolerance induction of tumor-specific T cells in P14/RIP(GP × Tag2) mice. (A) Deletion was assessed by isolating PDLNs, NDLNs, and spleens from P14, P14/RIP-GP, tumor-bearing P14/RIP-Tag2, and P14/RIP(GP × Tag2) mice. The percentage of P14 transgenic was determined by the percentage of Vα2+ of lymphocytes by flow cytometric analysis. Data shown are the mean and standard deviation of 3–7 mice per genotype. (B and C) Anergy was assessed by proliferation assay of PDLN cells (B) and NDLN cells (C). Lymph node cells were incubated with C57Bl/6 spleen cell stimulators prepulsed with 10−7 M GP33 or negative control peptide AV. Data shown are from two mice per genotype, and results are representative of four experiments.
Figure 6.
Figure 6.
Persistence of adoptively transferred tumor-specific T cells in RIP(GP × Tag2) mice. (A) Recovery of tumor-specific T cells from PDLNs was assessed 1, 2.5, and 6 wk after adoptive transfer of 5 × 10⁶ P14 T cells into control and RIP(GP × Tag2) hosts. Data from individual mice are shown, and the horizontal bar indicates the mean of each data set. (B) The indicated mice were killed 1 and 6 wk after adoptive transfer, and pancreatic sections stained for CD8+ T cells. All controls at the 1 wk time point had no infiltrating CD8+ T cells, as at the 6 wk time point. Each point represents the number of CD8+ T cells in one islet, and the horizontal bar indicates the mean value for each data set. CD8+ T cells in 11–28 individual islets from 5–8 different sections were enumerated for each data set.
Figure 6.
Figure 6.
Persistence of adoptively transferred tumor-specific T cells in RIP(GP × Tag2) mice. (A) Recovery of tumor-specific T cells from PDLNs was assessed 1, 2.5, and 6 wk after adoptive transfer of 5 × 10⁶ P14 T cells into control and RIP(GP × Tag2) hosts. Data from individual mice are shown, and the horizontal bar indicates the mean of each data set. (B) The indicated mice were killed 1 and 6 wk after adoptive transfer, and pancreatic sections stained for CD8+ T cells. All controls at the 1 wk time point had no infiltrating CD8+ T cells, as at the 6 wk time point. Each point represents the number of CD8+ T cells in one islet, and the horizontal bar indicates the mean value for each data set. CD8+ T cells in 11–28 individual islets from 5–8 different sections were enumerated for each data set.
Figure 7.
Figure 7.
Active immunotherapy induces efficient antitumor CTLs in P14/RIP(GP × Tag2) mice. (A–F) Administration of tumor-specific peptide and anti-CD40 mAb induces antitumor activity. (A–D) Tumor-bearing P14/RIP(GP × Tag2) and P14/RIP-Tag2 mice were treated with 5 μg of GP33 peptide intravenously followed 2 d later with 100 μg of anti-CD40 mAb intravenously. Pancreata were harvested 5 d after peptide injection and sections were stained for CD8 (A and B) and MHC class I (C and D). Arrows indicate the location of tumors. Original magnification: 100×. (E) Representative blood glucose levels after peptide injection are shown. (F) P14/RIP(GP × Tag2) and P14/RIP-Tag2 mice were treated with 5 μg of GP33 peptide intravenously followed 2 d later with 100 μg of anti-CD40 mAb intravenously or 100 μg of isotype-matched control Ab intravenously. Mean and standard error of survival after peptide injection are shown of 3–7 mice per group.
Figure 7.
Figure 7.
Active immunotherapy induces efficient antitumor CTLs in P14/RIP(GP × Tag2) mice. (A–F) Administration of tumor-specific peptide and anti-CD40 mAb induces antitumor activity. (A–D) Tumor-bearing P14/RIP(GP × Tag2) and P14/RIP-Tag2 mice were treated with 5 μg of GP33 peptide intravenously followed 2 d later with 100 μg of anti-CD40 mAb intravenously. Pancreata were harvested 5 d after peptide injection and sections were stained for CD8 (A and B) and MHC class I (C and D). Arrows indicate the location of tumors. Original magnification: 100×. (E) Representative blood glucose levels after peptide injection are shown. (F) P14/RIP(GP × Tag2) and P14/RIP-Tag2 mice were treated with 5 μg of GP33 peptide intravenously followed 2 d later with 100 μg of anti-CD40 mAb intravenously or 100 μg of isotype-matched control Ab intravenously. Mean and standard error of survival after peptide injection are shown of 3–7 mice per group.
Figure 8.
Figure 8.
Viral immunization and reimmunization of RIP(GP × Tag2) mice elicits antitumor activity. RIP-Tag2 and RIP(GP × Tag2) tumor-bearing mice were immunized with 2,000 PFU LCMV intravenously, or 106 PFU vacc-G2 intravenously, or were boosted with vacc-G2 upon tumor relapse after primary LCMV immunization. Mean and standard error of survival after initial immunization are shown of 5–14 mice per group.

Similar articles

Cited by

References

    1. Van Pel, A., P. van der Bruggen, P.G. Coulie, V.G. Brichard, B. Lethe, B. Van den Eynde, C. Uyttenhove, J.-C. Renauld, and T. Boon. 1995. Genes coding for tumor antigens recognized by cytolytic T lymphocytes. Immunol. Rev. 145:229–250. - PubMed
    1. Gilboa, E. 1999. The makings of a tumor rejection antigen. Immunity. 11:263–270. - PubMed
    1. Rosenberg, S.A. 1999. A new era for cancer immunotherapy based on the genes that encode cancer antigens. Immunity. 10:281–287. - PubMed
    1. Mizoguchi, H., J.J. O'Shea, D.L. Longo, C.M. Loeffler, D.W. McVicar, and A.C. Ochoa. 1992. Alterations in signal transduction molecules in T lymphocytes from tumor-bearing mice. Science. 258:1795–1798. - PubMed
    1. Alexander, J.P., S. Kudoh, K.A. Melsop, T.A. Hamilton, M.G. Edinger, R.R. Tubbs, D. Sica, L. Tuason, E. Klein, R.M. Bukowski, et al. 1993. T-cells infiltrating renal cell carcinoma display a poor proliferative response even though they can produce interleukin 2 and express interleukin 2 receptors. Cancer Res. 53:1380–1387. - PubMed

Publication types

MeSH terms