. 2002 Feb 4;195(3):283-93.
doi: 10.1084/jem.20011267.

Aging leads to disturbed homeostasis of memory phenotype CD8(+) cells

Affiliations

Aging leads to disturbed homeostasis of memory phenotype CD8(+) cells

Xiaohong Zhang et al. J Exp Med. .

Abstract

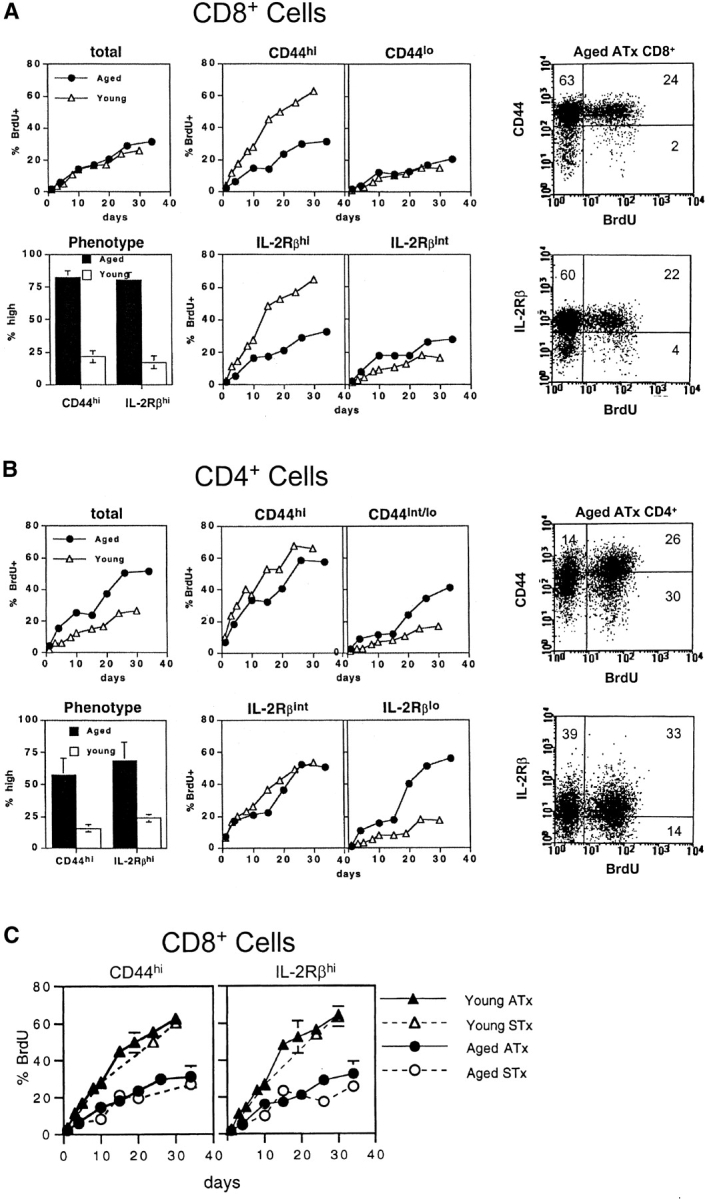
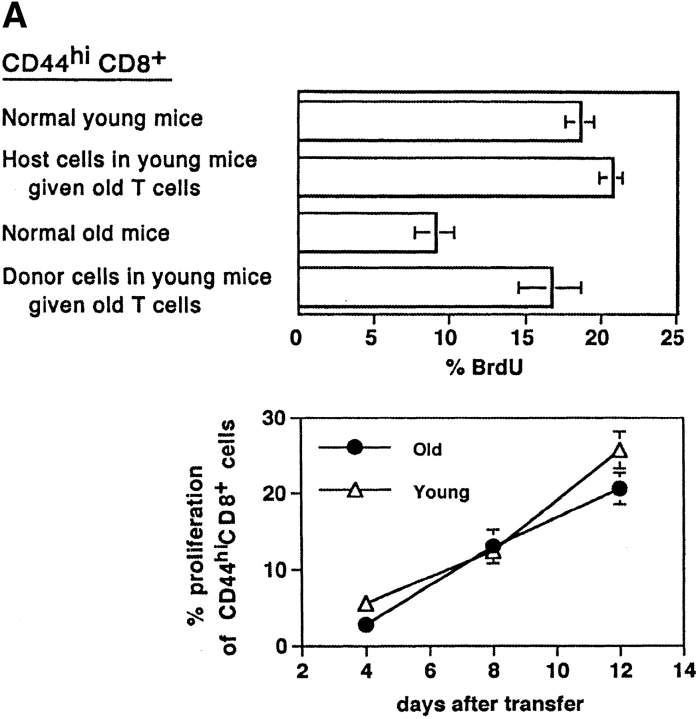
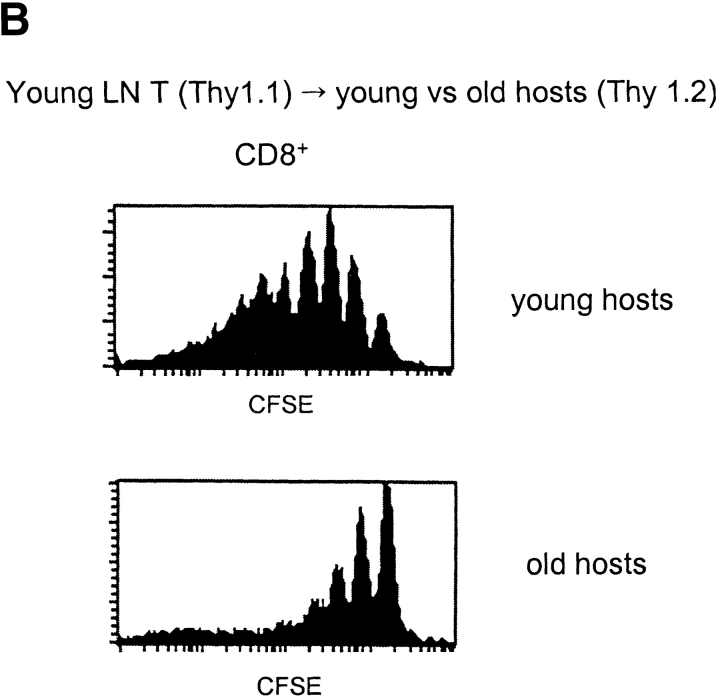
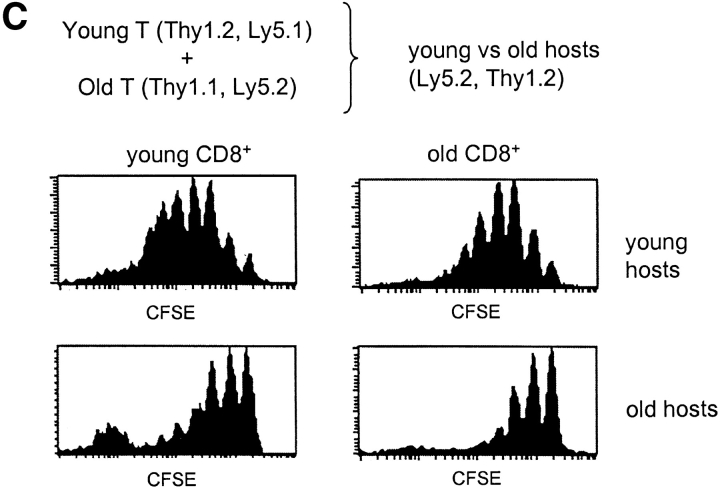
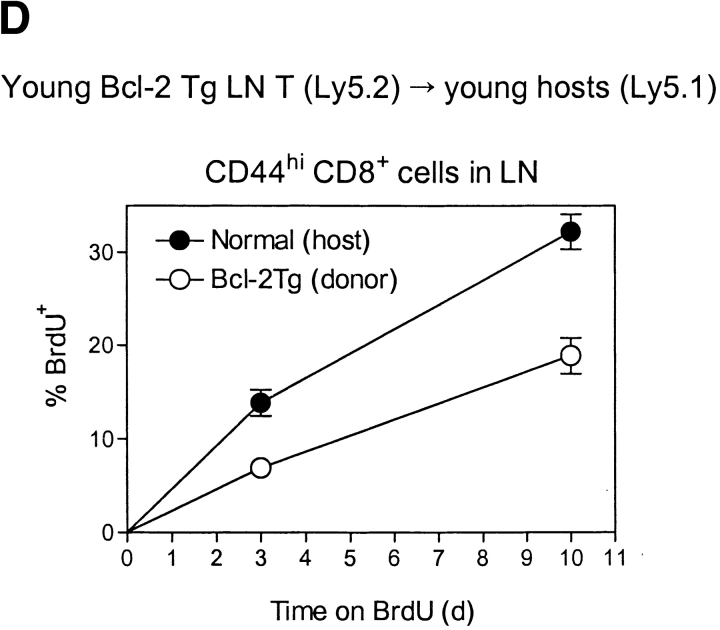
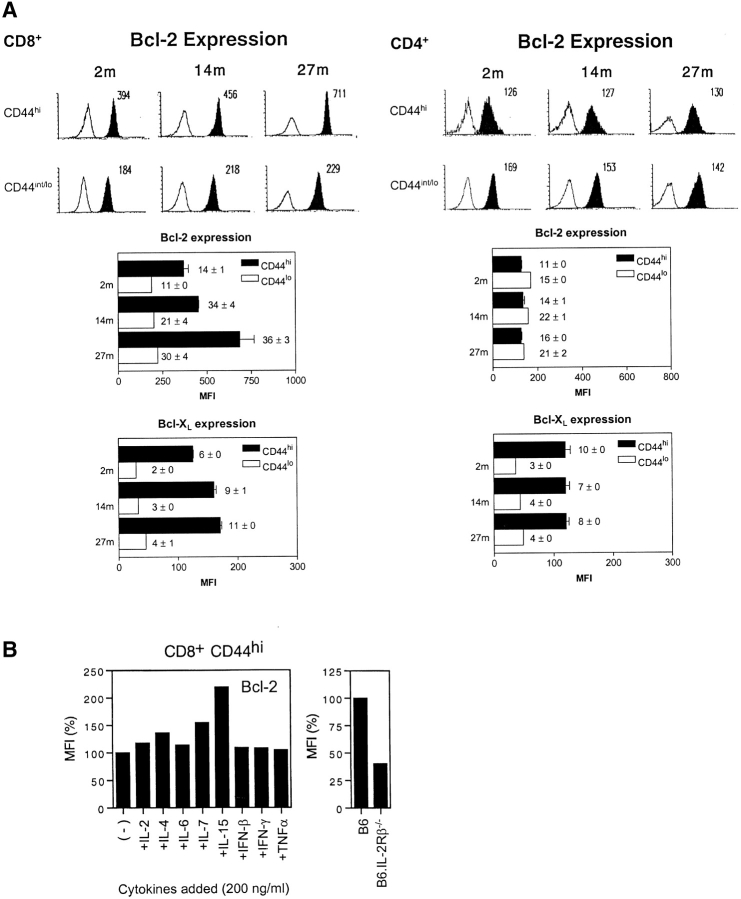
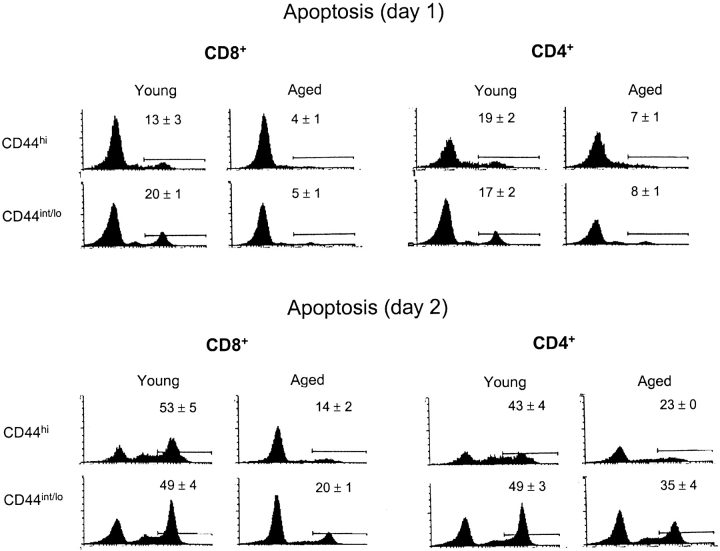
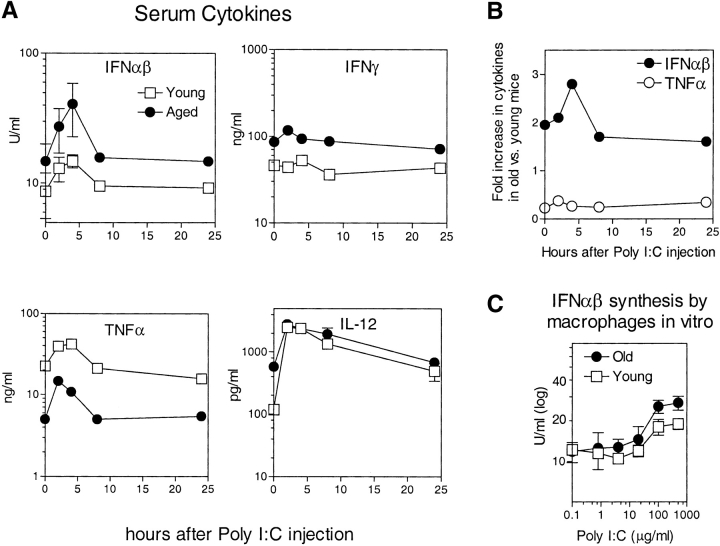
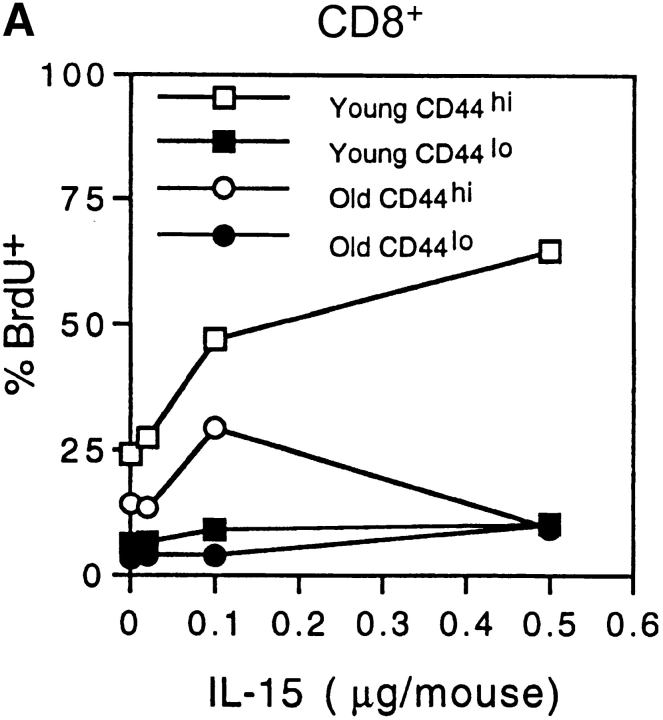
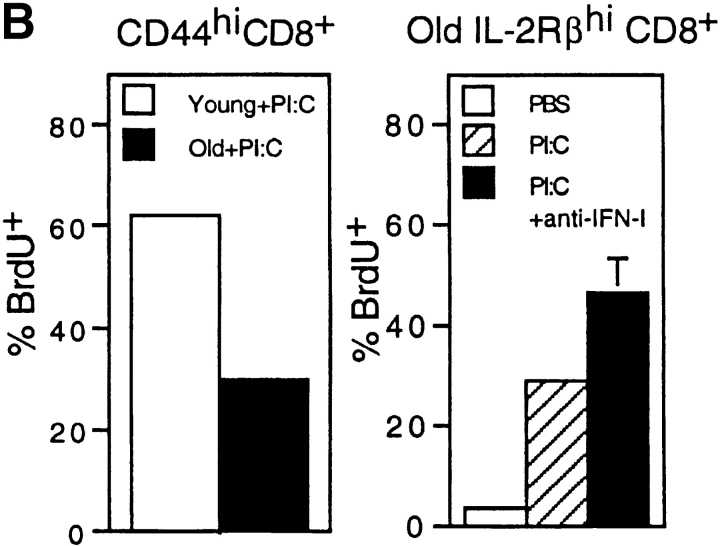
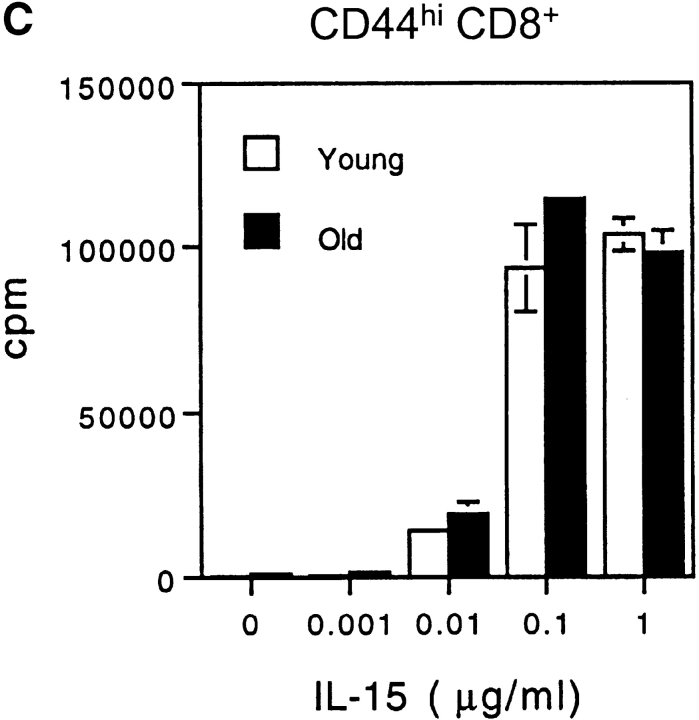
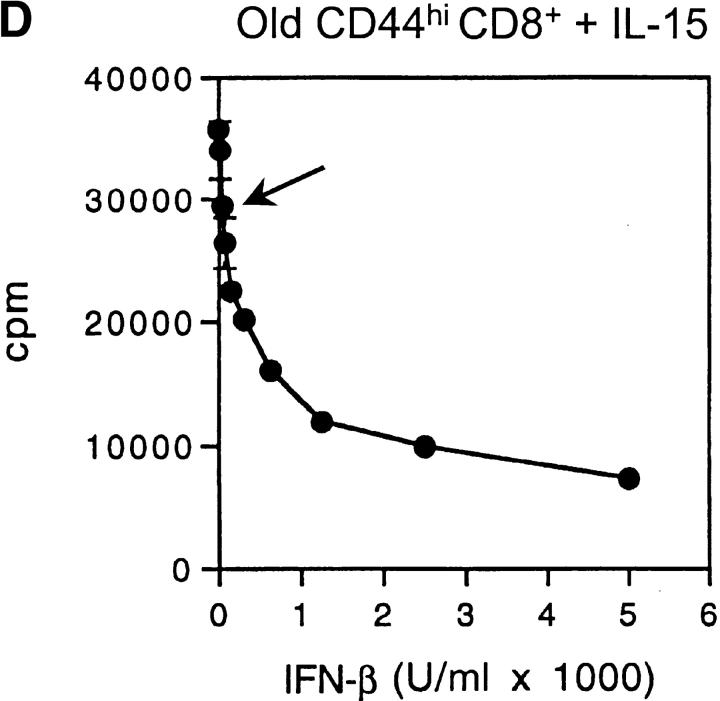
Examining the rate of in vivo T cell turnover (proliferation) in aged mice revealed a marked reduction in turnover at the level of memory-phenotype CD44(hi) CD8(+) cells relative to young mice. Based on adoptive transfer experiments, the reduced turnover of aged CD44(hi) CD8(+) cells reflected an inhibitory influence of the aged host environment. Aged CD44(hi) CD8(+) cells also showed poor in vivo responses to IL-15 and IL-15-inducing agents, but responded well to IL-15 in vitro. Two mechanisms could account for the reduced turnover of aged CD44(hi) CD8(+) cells in vivo. First, aging was associated with a prominent and selective increase in Bcl-2 expression in CD44(hi) CD8(+) cells. Hence, the reduced turnover of aged CD44(hi) CD8(+) cells may in part reflect the antiproliferative effect of enhanced Bcl-2 expression. Second, the impaired in vivo response of aged CD44(hi) CD8(+) cells to IL-15 correlated with increased serum levels of type I interferons (IFN-I) and was largely reversed by injection of anti-IFN-I antibody. Hence the selective reduction in the turnover of aged CD44(hi) CD8(+) cells in vivo may reflect the combined inhibitory effects of enhanced Bcl-2 expression and high IFN-I levels.


Figures

Figure 1.
Figure 1.
Turnover of T cell subsets in old and young mice. In A and B, groups of ATx old (2 y) and ATx young (3 mo) mice were placed on BrdU water for various periods. Spleen and LN suspensions were surface stained for CD4 and CD8 expression and also for expression of CD44 and IL-2Rβ. After fixation, the cells were then stained internally for BrdU incorporation using an anti-BrdU mAb and FACS® analyzed. The data show the mean percentage of BrdU labeling of pooled LN cells from two mice per group; labeling in spleen was quite similar. The bar graphs on the left show the percentage of T cells that display a memory phenotype in young versus old mice; dot plots for defining CD44hi versus CD44lo and IL-2Rβhi versus IL-2Rβint (for CD8+ cells) and IL-2Rβint versus IL-2Rβlo (for CD4+ cells) on aged ATx CD8+ cells from a representative mouse given BrdU for 26 d are shown on the right; quadrants were set on the basis of parallel staining of young T cells (data not shown). Note that for total (unseparated) CD8+ cells, the lack of a difference in turnover between young and old cells reflected the dominance of naive T cells (slow turnover) in young mice. In C, data on CD8+ cells from ATx mice (the same as in A) are compared with data from STx (euthymic) mice. The data show mean values (± SD) for two mice per point; for several of the points, SDs were too small to display.
Figure 2.
Figure 2.
Turnover of old and young T cells on adoptive transfer to old versus young hosts. (A, top) Doses of 107 nylon-wool-purified LN T cells from old Thy 1.2 donors were transferred intravenously into young Thy 1.1 hosts. After 3 d, the mice were placed on BrdU water for 3 d. Together with cells from normal old and young mice, LN cells from young hosts given old T cells were surface stained for CD8, Thy 1.2, Thy 1.1, and CD44 followed by internal staining for BrdU. The data (mean of three mice per group) show the percentage of BrdU+ cells for gated CD44hi CD8+ cells. In the adoptive transfer system, donor and host cells were detected on the basis of Thy 1.1 versus Thy 1.2 expression. (A, bottom) Purified populations of old Thy 1.2 T cells and young Thy 1.1 T cells were labeled with CFSE and transferred intravenously at a dose of 107 of each into young Thy 1.1 hosts. LN cells were removed from groups of these mice at the intervals shown and stained for CD8, CD44, Thy 1.1, and Thy 1.2. Gating on young (Thy 1.1+) versus old (Thy 1.2+) CD44hi CD8+ cells, the cells were analyzed for the intensity of CFSE labeling. The data show the percentage of CD44hi CD8+ cells that divided one or more times after transfer; the percentage of proliferation was calculated from the percentage of cells in each CFSE peak, followed by correction for cells that divided more than once. (B) Doses of 2 × 10⁶ CFSE-labeled purified LN T cells from young Thy 1.1 mice were transferred intravenously into young versus old hosts (Thy 1.2) pretreated with light irradiation (600 cGy). The data show CFSE labeling of donor (Thy 1.1+) CD8+ cells harvested from host LN on day 8. (C) A mixed population of CFSE-labeled young and old T cells (106 of each) was transferred intravenously to 600 cGy young versus old hosts; different Ly 5 and Thy 1 markers were used to define the two populations of donor cells and distinguish these cells from the host cells. The data show CFSE labeling of the donor cells recovered from host LN on day 8. (D) Doses of 2 × 10⁷ LN T cells from young Bcl-2 transgenic mice (Ly5.1) were transferred intravenously to young normal B6 Ly5.2 mice. At 1 mo after transfer the mice were given BrdU in the drinking water; lymphoid cells were then stained for surface markers and BrdU incorporation. The data (mean of three mice per group) show the percentage of BrdU incorporation by CD44hi CD8+ donor versus host LN cells after 3 d or 10 d on BrdU. Similar findings were seen in a second experiment in which the time between cell transfer and BrdU administration was reduced to 3 d (not shown). Note that for each experiment shown in A–D, the data are representative of 2–6 separate experiments.
Figure 2.
Figure 2.
Turnover of old and young T cells on adoptive transfer to old versus young hosts. (A, top) Doses of 107 nylon-wool-purified LN T cells from old Thy 1.2 donors were transferred intravenously into young Thy 1.1 hosts. After 3 d, the mice were placed on BrdU water for 3 d. Together with cells from normal old and young mice, LN cells from young hosts given old T cells were surface stained for CD8, Thy 1.2, Thy 1.1, and CD44 followed by internal staining for BrdU. The data (mean of three mice per group) show the percentage of BrdU+ cells for gated CD44hi CD8+ cells. In the adoptive transfer system, donor and host cells were detected on the basis of Thy 1.1 versus Thy 1.2 expression. (A, bottom) Purified populations of old Thy 1.2 T cells and young Thy 1.1 T cells were labeled with CFSE and transferred intravenously at a dose of 107 of each into young Thy 1.1 hosts. LN cells were removed from groups of these mice at the intervals shown and stained for CD8, CD44, Thy 1.1, and Thy 1.2. Gating on young (Thy 1.1+) versus old (Thy 1.2+) CD44hi CD8+ cells, the cells were analyzed for the intensity of CFSE labeling. The data show the percentage of CD44hi CD8+ cells that divided one or more times after transfer; the percentage of proliferation was calculated from the percentage of cells in each CFSE peak, followed by correction for cells that divided more than once. (B) Doses of 2 × 10⁶ CFSE-labeled purified LN T cells from young Thy 1.1 mice were transferred intravenously into young versus old hosts (Thy 1.2) pretreated with light irradiation (600 cGy). The data show CFSE labeling of donor (Thy 1.1+) CD8+ cells harvested from host LN on day 8. (C) A mixed population of CFSE-labeled young and old T cells (106 of each) was transferred intravenously to 600 cGy young versus old hosts; different Ly 5 and Thy 1 markers were used to define the two populations of donor cells and distinguish these cells from the host cells. The data show CFSE labeling of the donor cells recovered from host LN on day 8. (D) Doses of 2 × 10⁷ LN T cells from young Bcl-2 transgenic mice (Ly5.1) were transferred intravenously to young normal B6 Ly5.2 mice. At 1 mo after transfer the mice were given BrdU in the drinking water; lymphoid cells were then stained for surface markers and BrdU incorporation. The data (mean of three mice per group) show the percentage of BrdU incorporation by CD44hi CD8+ donor versus host LN cells after 3 d or 10 d on BrdU. Similar findings were seen in a second experiment in which the time between cell transfer and BrdU administration was reduced to 3 d (not shown). Note that for each experiment shown in A–D, the data are representative of 2–6 separate experiments.
Figure 3.
Figure 3.
Bcl-2 and Bcl–XL expression in young versus old T cells. (A) LN cells from B6 mice aged 2, 14, and 27 mo were surface stained for CD4, CD8 and CD44 and then, after fixation and permeabilization, stained internally for Bcl-2 or Bcl-XL. The data show representative staining for Bcl-2 (top panel) and mean MFI values (± SD) for Bcl-2 and Bcl-XL staining (middle and lower panels) for 3–6 mice per group; in the middle and lower panels, ratios ± SD of MFI staining for Bcl-2 and Bcl–XL versus MFI staining with an irrelevant control mAb are inserted. (B) Effect of cytokines on Bcl-2 expression in young CD44hi CD8+ cells. (Left) CD44hi CD8+ cells were purified by FACS® sorting and cultured in 200 ng/ml of the cytokines shown for 18 h and then stained internally for Bcl-2 expression after surface staining for CD8 and CD44. MFI values relative to cells cultured without cytokines are shown. (Right) Bcl-2 expression in fresh CD44hi CD8+ cells from normal B6 versus B6.IL-2Rβ–/– mice. MFI values relative to staining of B6 cells are shown.
Figure 4.
Figure 4.
Spontaneous apoptosis of old versus young T cells after culture in vitro in medium alone. Nylon-wool-purified LN T cells from old versus young mice were cultured in standard tissue culture medium (Materials and Methods). After 1 or 2 d, the cells were surface stained for CD4, CD8, and CD44 followed by fixation and internal staining by TUNEL for apoptosis. The data show TUNEL staining on gated CD8+ and CD4+ subsets of cells. Numbers refer to mean data (± SD) for triplicate cultures. Two other experiments gave comparable results.
Figure 5.
Figure 5.
(A) Levels of cytokines in serum. To prepare serum, blood was drawn from groups of old and young mice before and after injection of Poly I:C (100 μg intraperitoneally); the mice were killed at each time point shown. Serum concentrations of IFN-αβ (IFN-I), IFN-γ, TNF-α, and IL-12 were measured by ELISA; note that the antibody used to detect IFN-I did not distinguish between IFN-α and IFN-β. For IFN-αβ and IL-12, serum from individual mice was tested, and the data show mean values (± SD) for 4–6 mice for each time point; where not shown, SDs were too small to display. For IFN-γ and TNF-α, cytokine levels were measured on serum pooled from 4–6 mice. (B) For IFN-αβ and TNF-α, the data in A are shown as fold-increases for old mice relative to young mice. (C) To measure cytokine production by macrophages, thioglycollate-induced macrophages from old and young mice were cultured in vitro at 106 cells per milliliter, either alone or in the presence of graded concentrations of Poly I:C. Supernatants were taken from the cultures on day 3 and concentrations of IFN-αβ were measured by ELISA. The data show means (± SD) of cultures from individual mice (four mice per group).
Figure 6.
Figure 6.
Capacity of IFN-I to inhibit responses of CD44hi CD8+ cells to IL-15. (A) Response of young versus old mice to IL-15. Various doses of mouse rIL-15 were injected intravenously into young and old B6 mice. The mice were immediately injected with BrdU and then given BrdU in the drinking water. On day 2 after IL-15 injection, LN cells pooled from two mice per group were stained internally for BrdU incorporation after surface staining for CD4, CD8, and CD44. The data show the percentage of BrdU+ cells for gated CD44hi and CD44lo CD8+ cells. (B) Response of young and old mice to Poly I:C (PI:C). (Left) young versus old mice were injected with PI:C (100 μg/mouse intraperitoneally) and then given BrdU as in A, followed by staining on day 3 for BrdU and surface markers. Gating on CD44hi CD8+ cells, the data show the percentage BrdU+ cells for LN pooled from two mice. (Right) Old mice were injected with saline (PBS), PI:C, or PI:C plus anti–IFN-β antiserum (32,000 U/mouse given in two injections at 36 h and 48 h after PI:C) and given BrdU from day 0–3 followed by staining for BrdU and surface markers. Gating on IL-2Rβhi CD8+ cells, the data show mean percentage of BrdU+ cells (± SD) for LN cells from three mice; where not shown SDs were too small to display. Gating on CD44hi CD8+ cells (>90% IL-2Rβhi) gave similar results (data not shown). (C) Response of young versus old CD44hi CD8+ cells to IL-15 in vitro. FACS®-purified CD44hi CD8+ cells were cultured with the indicated concentrations of rIL-15 for 2 d; 3[H]TdR was added during the last 8 h of culture. The data show mean levels of 3[H]TdR incorporation for triplicate cultures (± SD). (D) Response of old CD44hi CD8+ cells to IL-15 in the presence of IFN-I. Purified CD44hi CD8+ cells from old mice were cultured with IL-15 (20 ng/ml) plus various concentrations of IFN-β (doubling dilutions down to 20 U/ml). 3[H]TdR was added on day 2. The data show mean levels of 3[H]TdR incorporation for triplicate cultures on day 2. The arrow marks the response with IFN-β at 40 U/ml. For each experiment shown in the figure, the data are representative of two to three separate experiments.
Figure 6.
Figure 6.
Capacity of IFN-I to inhibit responses of CD44hi CD8+ cells to IL-15. (A) Response of young versus old mice to IL-15. Various doses of mouse rIL-15 were injected intravenously into young and old B6 mice. The mice were immediately injected with BrdU and then given BrdU in the drinking water. On day 2 after IL-15 injection, LN cells pooled from two mice per group were stained internally for BrdU incorporation after surface staining for CD4, CD8, and CD44. The data show the percentage of BrdU+ cells for gated CD44hi and CD44lo CD8+ cells. (B) Response of young and old mice to Poly I:C (PI:C). (Left) young versus old mice were injected with PI:C (100 μg/mouse intraperitoneally) and then given BrdU as in A, followed by staining on day 3 for BrdU and surface markers. Gating on CD44hi CD8+ cells, the data show the percentage BrdU+ cells for LN pooled from two mice. (Right) Old mice were injected with saline (PBS), PI:C, or PI:C plus anti–IFN-β antiserum (32,000 U/mouse given in two injections at 36 h and 48 h after PI:C) and given BrdU from day 0–3 followed by staining for BrdU and surface markers. Gating on IL-2Rβhi CD8+ cells, the data show mean percentage of BrdU+ cells (± SD) for LN cells from three mice; where not shown SDs were too small to display. Gating on CD44hi CD8+ cells (>90% IL-2Rβhi) gave similar results (data not shown). (C) Response of young versus old CD44hi CD8+ cells to IL-15 in vitro. FACS®-purified CD44hi CD8+ cells were cultured with the indicated concentrations of rIL-15 for 2 d; 3[H]TdR was added during the last 8 h of culture. The data show mean levels of 3[H]TdR incorporation for triplicate cultures (± SD). (D) Response of old CD44hi CD8+ cells to IL-15 in the presence of IFN-I. Purified CD44hi CD8+ cells from old mice were cultured with IL-15 (20 ng/ml) plus various concentrations of IFN-β (doubling dilutions down to 20 U/ml). 3[H]TdR was added on day 2. The data show mean levels of 3[H]TdR incorporation for triplicate cultures on day 2. The arrow marks the response with IFN-β at 40 U/ml. For each experiment shown in the figure, the data are representative of two to three separate experiments.

Similar articles

Cited by

References

    1. Hodes, R. 1997. Aging and the immune system. Immunol. Rev. 160:5–8. - PubMed
    1. Miller, R.A., G. Garcia, C.J. Kirk, and J.M. Witkowski. 1997. Early activation defects in T lymphocytes from aged mice. Immunol. Rev. 160:79–90. - PubMed
    1. Linton, P.J., L. Haynes, L. Tsui, X. Zhang, and S. Swain. 1997. From naive to effector—alterations with aging. Immunol. Rev. 160:9–18. - PubMed
    1. Chakravarti, B., and G.N. Abraham. 1999. Aging and T-cell-mediated immunity. Mech. Ageing Dev. 108:183–206. - PubMed
    1. Rosenstein, M.M., and H.R. Strausser. 1980. Macrophage-induced T cell mitogen suppression with age. J. Reticuloendothel. Soc. 27:159–166. - PubMed

Publication types

MeSH terms