

doi: 10.1073/pnas.022387699.
Protein folding mediated by solvation: water expulsion and formation of the hydrophobic core occur after the structural collapse
Affiliations
- PMID: 11805324
- PMCID: PMC117366
- DOI: 10.1073/pnas.022387699
Item in Clipboard
Protein folding mediated by solvation: water expulsion and formation of the hydrophobic core occur after the structural collapse
Proc Natl Acad Sci U S A.
.
Abstract
The interplay between structure-search of the native structure and desolvation in protein folding has been explored using a minimalist model. These results support a folding mechanism where most of the structural formation of the protein is achieved before water is expelled from the hydrophobic core. This view integrates water expulsion effects into the funnel energy landscape theory of protein folding. Comparisons to experimental results are shown for the SH3 protein. After the folding transition, a near-native intermediate with partially solvated hydrophobic core is found. This transition is followed by a final step that cooperatively squeezes out water molecules from the partially hydrated protein core.
Figures
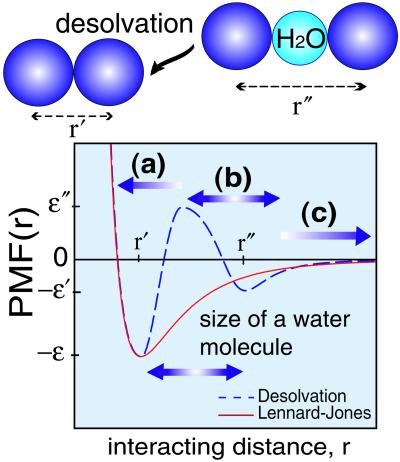
A schematic representation of a phenomenological potential for tertiary contact formation which includes the possibility of desolvation. r′ and r" label the residue–residue contact minimum and the single water molecule-separated contact minimum, respectively. The parameters for energies are adapted from the refs. and , where ɛ" − ɛ′/ɛ′ − ɛ = 1.33, ɛ′/ɛ = 1/3. The desolvation barrier allows for a clear determination of whether a native contact is formed. Three regions are defined: (i) when the separation distance between residues r is shorter than the range of the desolvation barrier, then a native contact is formed; (ii) when the residues are separated from the desolvation barrier by a single water molecule (3 Å) distance, then a “pseudo contact” (i.e., the first hydration shell) is formed; (iii) when the residues are separated by multiple hydration shells, no contact is formed. By using this simple rule, the degree of nativeness of any configuration is easily determined. The normalized density of the native contacts (Q) and the native “pseudo contacts” (pseudo Q) are appropriate parameters to characterize the degree of nativeness and of desolvation. For comparison, a Lennard–Jones type potential (in red) is presented in the figure.

A and B show the free-energy diagrams plotted as the function of folding parameters Q and pseudo Q at the folding temperature (Tf, where kBTf/ɛ = 1.28) and 0.88Tf, respectively. Q and pseudo Q are the normalized density of native contacts and pseudo native contacts (see Fig. 1). Free energies are measured in units of kBT (T = Tf in A or 0.88Tf in B) where blue (red) stands for low (high) value of these. Pseudo Q ranges are approximately between 0 and 0.3. Pseudo Q appears to decline sharply at Q ≥ 0.8, indicating the system expels water at this stage. A typical folding trajectory is superimposed on the free-energy landscape at T = 0.88Tf (D). In addition, Q, pseudo Q (C) and contact energy (E) are plotted as a function of integration time step. Using the same desolvation potential presented in Fig. 1, this trajectory is simulated by Langevin dynamics. The folding run was recorded for another 106 steps after Q reaches 1. According to the distinct transitions indicated by the contact energy in (E), the folding mechanism is characterized by two stages: a structural collapse toward a nearly native ensemble at a time τ1, which is followed by water expulsion from the hydrophobic core at a time τ2. To have a better understanding of the kinetics, several snapshots of the chain are shown in which a blue sphere is used to identify pseudo contacts (i.e., single water molecule-separated residues). In addition, we color the residues with formed native contacts in red to specify the folded portion of the protein and the unfolded portion in gray. In this trajectory, (a) shows an unfolded configuration where only the short-range native contacts are formed. This early step is followed by a transition indicating the structural collapse to the nearly native ensemble (b → c) in which Q increases and pseudo Q decreases. The configuration shown in (b) has 31 pseudo contacts formed. After excluding the possibility that some of these pseudo contacts use the same water molecules, 23 “water” molecules are expelled cooperatively during this transition (the principle of excluded volume is used to determine whether pseudo contacts possibly use the same water molecule). Notably, the native contact formation between the diverging turn (Dv) and the distal loop (Dt) (indicated by a broken green circle) is crucial for this structural collapse. This region overlaps with the experimentally determined high φ-value regions (46, 47). The final transition involves the mechanism of water expulsion from the partially hydrated hydrophobic core (d → e). This transition involves the formation of long-range tertiary contacts across the two sandwiched β-sheets. Configuration (d) has 20 pseudo contacts in the hydrophobic core and the terminal regions. After excluding the possibility that some of these pseudo contacts use the same water molecules, 17 “water” molecules are expelled cooperatively during this final transition. Configuration (e) has only a few residual “water” molecules in the terminal regions. To emphasize this collective behavior of water expulsion during the interval of the final transition, an Inset in C shows that the number of native pseudo contacts decreases abruptly (N is the number of total native contacts).
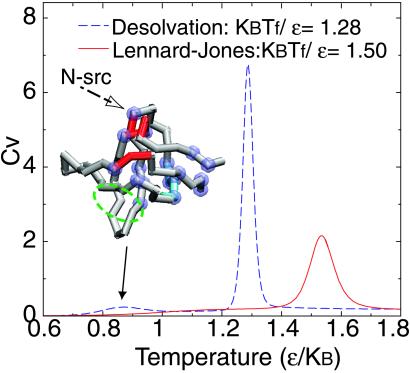
The cooperativity of folding of models using the desolvation and Lennard–Jones potentials are compared by plotting specific heat as a function of temperature. The enthalpy change for both models at individual folding temperatures is the same. The sharper profile of the specific heat implies stronger cooperativity of folding in the desolvation model than that for the Lennard–Jones model. Noticeably, at low temperature, there is a broad but small peak in the desolvation model. This low temperature feature corresponds to minute fluctuations of the native structure (where Q ≤ 0.93, pseudo Q ≤ 0.07). The origin of the fluctuation at low temperature is attributed to very few sporadically formed pseudo contacts found at the termini regions, hydrophobic core, several intrahairpins, or loops that are in the proximity of the termini. In the Inset with an SH3 structure, the top 30% residues that possibly form pseudo contacts at low temperatures are highlighted with purple balls. In comparison, the regions colored in red are the binding site of the protein to the proline-rich peptide. The green broken circles label the experimentally determined high φ-value regions (45, 46). The β-sheet colored in cyan is the region, in addition to termini and loops regions, suggested by the NMR experiments (50, 51) to account for the conformational changes under near-native conditions as temperature mildly increases.
Similar articles
-
Probing the folding free energy landscape of the Src-SH3 protein domain.Proc Natl Acad Sci U S A. 2002 Dec 10;99(25):16064-8. doi: 10.1073/pnas.242293099. Epub 2002 Nov 22. Proc Natl Acad Sci U S A. 2002. PMID: 12446834 Free PMC article.
-
Posttransition state desolvation of the hydrophobic core of the src-SH3 protein domain.Biophys J. 2003 Jul;85(1):61-9. doi: 10.1016/S0006-3495(03)74454-3. Biophys J. 2003. PMID: 12829464 Free PMC article.
-
Temperature dependence of the free energy landscape of the src-SH3 protein domain.Proteins. 2004 May 1;55(2):395-406. doi: 10.1002/prot.20053. Proteins. 2004. PMID: 15048830
-
Recent successes of the energy landscape theory of protein folding and function.Q Rev Biophys. 2005 Nov;38(4):405-10. doi: 10.1017/S0033583505004075. Q Rev Biophys. 2005. PMID: 16934172 Review.
-
Theory of protein folding: the energy landscape perspective.Annu Rev Phys Chem. 1997;48:545-600. doi: 10.1146/annurev.physchem.48.1.545. Annu Rev Phys Chem. 1997. PMID: 9348663 Review.
Cited by
-
Strain-dependent fractional molecular diffusion in humid spider silk fibres.J R Soc Interface. 2016 Sep;13(122):20160506. doi: 10.1098/rsif.2016.0506. J R Soc Interface. 2016. PMID: 27628174 Free PMC article.
-
Kinetic rate constant prediction supports the conformational selection mechanism of protein binding.PLoS Comput Biol. 2012 Jan;8(1):e1002351. doi: 10.1371/journal.pcbi.1002351. Epub 2012 Jan 12. PLoS Comput Biol. 2012. PMID: 22253587 Free PMC article.
-
A hypothesis to reconcile the physical and chemical unfolding of proteins.Proc Natl Acad Sci U S A. 2015 May 26;112(21):E2775-84. doi: 10.1073/pnas.1500352112. Epub 2015 May 11. Proc Natl Acad Sci U S A. 2015. PMID: 25964355 Free PMC article.
-
Hydration of the folding transition state ensemble of a protein.Biochemistry. 2006 Mar 21;45(11):3473-80. doi: 10.1021/bi052638z. Biochemistry. 2006. PMID: 16533028 Free PMC article.
-
Visualizing water molecules in transmembrane proteins using radiolytic labeling methods.Biochemistry. 2010 Feb 9;49(5):827-34. doi: 10.1021/bi901889t. Biochemistry. 2010. PMID: 20047303 Free PMC article. Review.
References
Publication types
MeSH terms
Substances
LinkOut - more resources
Full Text Sources
Other Literature Sources
