

Insulin-stimulated phosphorylation of lipin mediated by the mammalian target of rapamycin
- PMID: 11792863
- PMCID: PMC117427
- DOI: 10.1073/pnas.022634399
Insulin-stimulated phosphorylation of lipin mediated by the mammalian target of rapamycin
Abstract
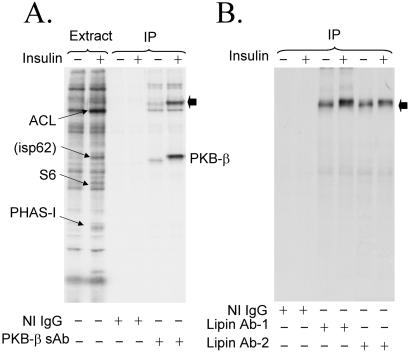
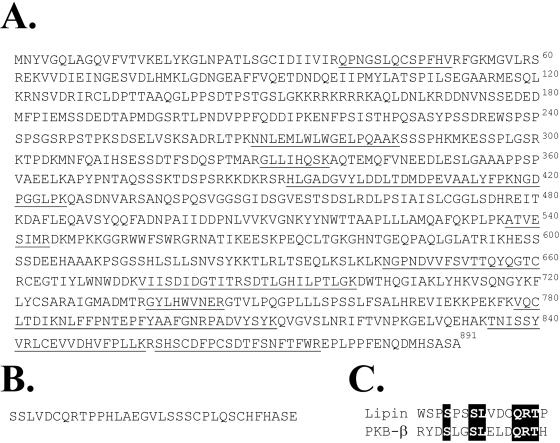
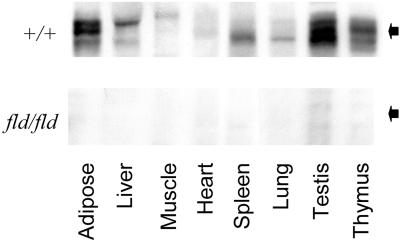
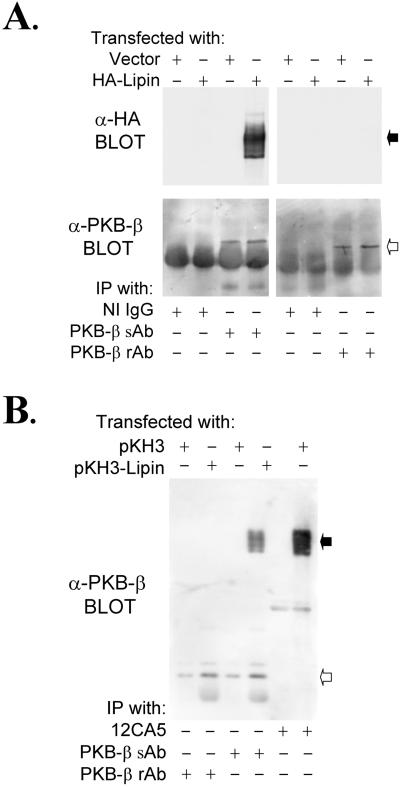
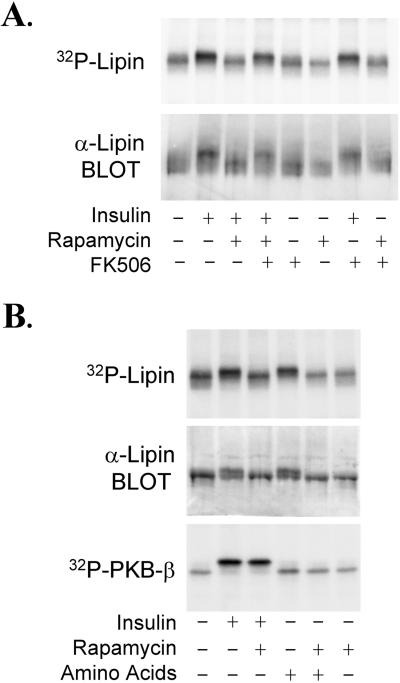
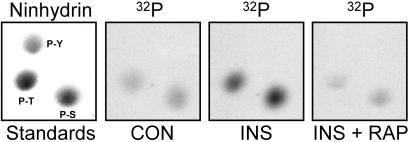
The phosphorylation of a previously uncharacterized protein of apparent M(r) approximately 140,000 was found to be increased when rat adipocytes were incubated with insulin. The sequences of peptides generated by digesting the protein with trypsin matched perfectly with sequences in mouse lipin. Lipin is the product of the gene that is mutated in fatty liver dystrophy (fld) mice [Peterfy, M., Phan, J., Xu, P. & Reue, K (2001) Nat. Genet. 27, 121-124], which exhibit several phenotypic abnormalities including hyperlipidemia, defects in adipocyte differentiation, impaired glucose tolerance, and slow growth. When immunoblots were prepared with lipin antibodies, both endogenous adipocyte lipin and recombinant lipin overexpressed in HEK293 cells appeared as bands ranging in apparent M(r) from 120,000 to 140,000. Incubating adipocytes with insulin decreased the electrophoretic mobility and stimulated the phosphorylation of both Ser and Thr residues in lipin. The effects of insulin were abolished by inhibitors of phosphatidylinositol 3-OH kinase, and by rapamycin, a specific inhibitor of the mammalian target of rapamcyin (mTOR). The inhibition by rapamycin was blocked by FK506, which competitively inhibits those effects of rapamycin that are mediated by inhibition of mTOR. Moreover, amino acids, which activate mTOR, mimicked insulin by increasing lipin phosphorylation in a rapamycin-sensitive manner. Thus, lipin represents a target of the mTOR pathway, and potentially links this nutrient-sensing pathway to adipocyte development.
Figures
Similar articles
-
Activation of the mammalian target of rapamycin pathway acutely inhibits insulin signaling to Akt and glucose transport in 3T3-L1 and human adipocytes.Endocrinology. 2005 Mar;146(3):1328-37. doi: 10.1210/en.2004-0777. Epub 2004 Dec 2. Endocrinology. 2005. PMID: 15576463
-
Amino acids and leucine allow insulin activation of the PKB/mTOR pathway in normal adipocytes treated with wortmannin and in adipocytes from db/db mice.FASEB J. 2004 Dec;18(15):1894-6. doi: 10.1096/fj.03-1409fje. Epub 2004 Oct 12. FASEB J. 2004. PMID: 15479767
-
Mammalian target of rapamycin pathway regulates insulin signaling via subcellular redistribution of insulin receptor substrate 1 and integrates nutritional signals and metabolic signals of insulin.Mol Cell Biol. 2001 Aug;21(15):5050-62. doi: 10.1128/MCB.21.15.5050-5062.2001. Mol Cell Biol. 2001. PMID: 11438661 Free PMC article.
-
Modulation of the protein kinase activity of mTOR.Curr Top Microbiol Immunol. 2004;279:199-213. doi: 10.1007/978-3-642-18930-2_12. Curr Top Microbiol Immunol. 2004. PMID: 14560959 Review.
-
Lipin - The bridge between hepatic glycerolipid biosynthesis and lipoprotein metabolism.Biochim Biophys Acta. 2010 Dec;1801(12):1249-59. doi: 10.1016/j.bbalip.2010.07.008. Epub 2010 Aug 6. Biochim Biophys Acta. 2010. PMID: 20692363 Review.
Cited by
-
Roles of phosphatidate phosphatase enzymes in lipid metabolism.Trends Biochem Sci. 2006 Dec;31(12):694-9. doi: 10.1016/j.tibs.2006.10.003. Epub 2006 Oct 31. Trends Biochem Sci. 2006. PMID: 17079146 Free PMC article. Review.
-
The lipin protein family: dual roles in lipid biosynthesis and gene expression.FEBS Lett. 2008 Jan 9;582(1):90-6. doi: 10.1016/j.febslet.2007.11.014. Epub 2007 Nov 20. FEBS Lett. 2008. PMID: 18023282 Free PMC article. Review.
-
Tyrosine kinase inhibitors and anti-angiogenic therapies in kidney cancer.Curr Treat Options Oncol. 2007 Jun;8(3):211-26. doi: 10.1007/s11864-007-0031-3. Curr Treat Options Oncol. 2007. PMID: 17712534 Review.
-
Lipins: multifunctional lipid metabolism proteins.Annu Rev Nutr. 2010 Aug 21;30:257-72. doi: 10.1146/annurev.nutr.012809.104729. Annu Rev Nutr. 2010. PMID: 20645851 Free PMC article. Review.
-
Frontier of epilepsy research - mTOR signaling pathway.Exp Mol Med. 2011 May 31;43(5):231-74. doi: 10.3858/emm.2011.43.5.032. Exp Mol Med. 2011. PMID: 21467839 Free PMC article. Review.
References
-
- Avruch J. Mol Cell Biochem. 1998;182:31–48. - PubMed
-
- Avruch J, Alexander M C, Palmer J L, Pierce M W, Nemenoff R A, Blackshear P J, Tipper J P, Witters L A. Fed Proc. 1982;41:2629–2633. - PubMed
-
- Benjamin W B, Singer I. Biochemistry. 1975;14:3301–3309. - PubMed
-
- Denton R M, Brownsey R W, Belsham G J. Diabetologia. 1981;21:347–362. - PubMed
-
- Shepherd P R, Nave B T, O'Rahilly S. J Mol Endocrinol. 1996;17:175–184. - PubMed
Publication types
MeSH terms
Substances
Associated data
- Actions
Grants and funding
LinkOut - more resources
Full Text Sources
Other Literature Sources
Medical
Molecular Biology Databases
Miscellaneous
