

Mutation rates in mammalian genomes
- PMID: 11792858
- PMCID: PMC117386
- DOI: 10.1073/pnas.022629899
Mutation rates in mammalian genomes
Abstract
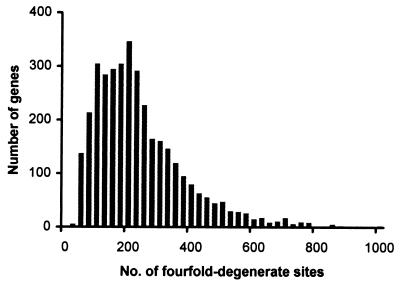
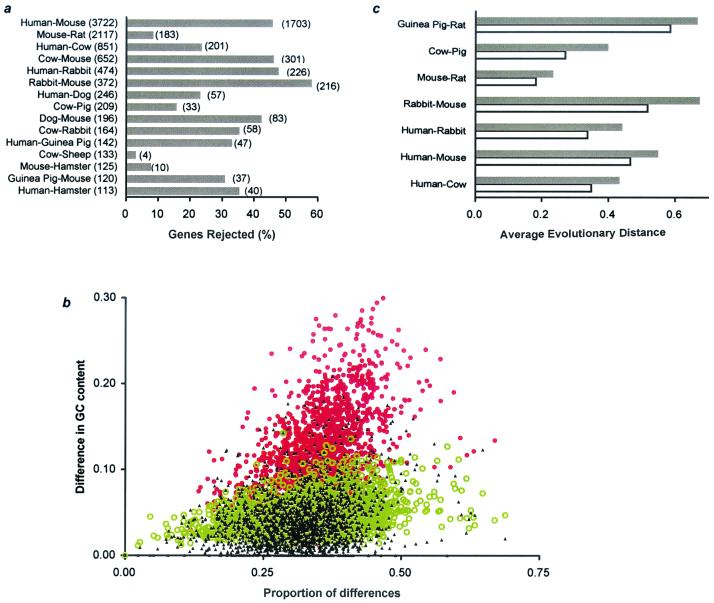
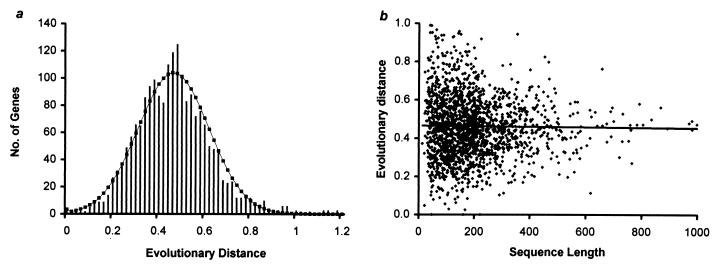
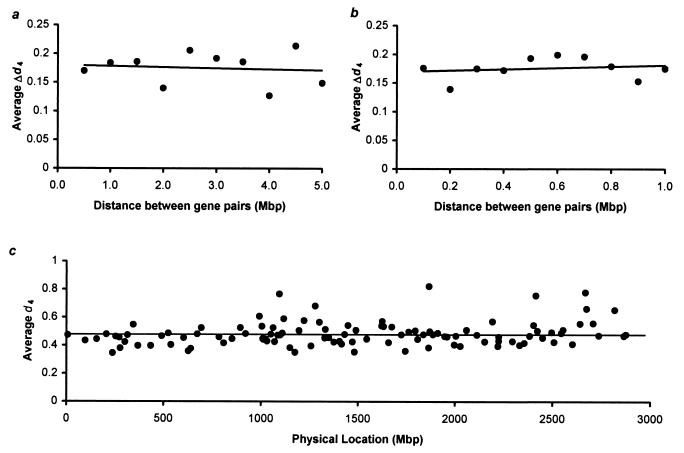
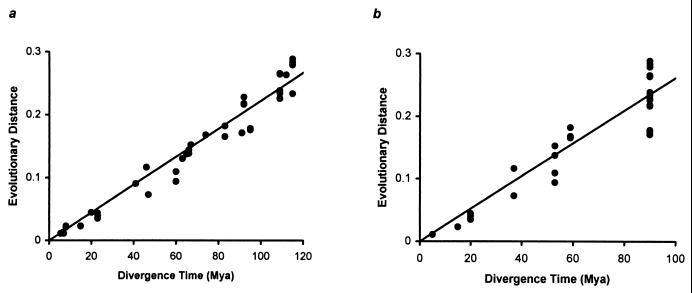
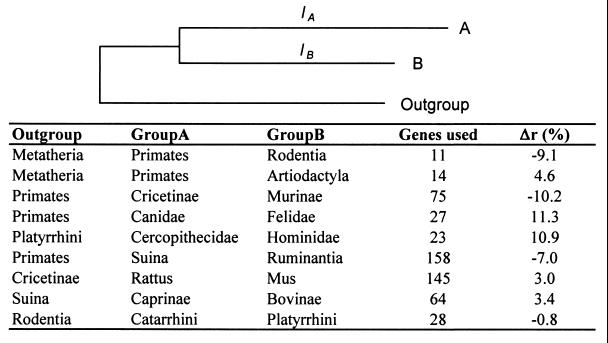
Knowledge of the rate of point mutation is of fundamental importance, because mutations are a vital source of genetic novelty and a significant cause of human diseases. Currently, mutation rate is thought to vary many fold among genes within a genome and among lineages in mammals. We have conducted a computational analysis of 5,669 genes (17,208 sequences) from species representing major groups of placental mammals to characterize the extent of mutation rate differences among genes in a genome and among diverse mammalian lineages. We find that mutation rate is approximately constant per year and largely similar among genes. Similarity of mutation rates among lineages with vastly different generation lengths and physiological attributes points to a much greater contribution of replication-independent mutational processes to the overall mutation rate. Our results suggest that the average mammalian genome mutation rate is 2.2 x 10(-9) per base pair per year, which provides further opportunities for estimating species and population divergence times by using molecular clocks.
Figures
Similar articles
-
Complementary evolution of coding and noncoding sequence underlies mammalian hairlessness.Elife. 2022 Nov 7;11:e76911. doi: 10.7554/eLife.76911. Elife. 2022. PMID: 36342464 Free PMC article.
-
Patterns of nucleotide substitution in Drosophila and mammalian genomes.Proc Natl Acad Sci U S A. 1999 Feb 16;96(4):1475-9. doi: 10.1073/pnas.96.4.1475. Proc Natl Acad Sci U S A. 1999. PMID: 9990048 Free PMC article.
-
Similarity of synonymous substitution rates across mammalian genomes.J Mol Evol. 2007 Sep;65(3):236-48. doi: 10.1007/s00239-007-9008-x. Epub 2007 Aug 3. J Mol Evol. 2007. PMID: 17674075
-
Mutation rate variation in the mammalian genome.Curr Opin Genet Dev. 2003 Dec;13(6):562-8. doi: 10.1016/j.gde.2003.10.008. Curr Opin Genet Dev. 2003. PMID: 14638315 Review.
-
The promise of comparative genomics in mammals.Science. 1999 Oct 15;286(5439):458-62, 479-81. doi: 10.1126/science.286.5439.458. Science. 1999. PMID: 10521336 Review.
Cited by
-
Novel genome sequence of Chinese cavefish (Triplophysa rosa) reveals pervasive relaxation of natural selection in cavefish genomes.Mol Ecol. 2022 Nov;31(22):5831-5845. doi: 10.1111/mec.16700. Epub 2022 Oct 2. Mol Ecol. 2022. PMID: 36125323 Free PMC article.
-
A comprehensive atlas of nuclear sequences of mitochondrial origin (NUMT) inserted into the pig genome.Genet Sel Evol. 2024 Sep 16;56(1):64. doi: 10.1186/s12711-024-00930-6. Genet Sel Evol. 2024. PMID: 39285356 Free PMC article.
-
Evolutionary sequence analysis of complete eukaryote genomes.BMC Bioinformatics. 2005 Mar 11;6:53. doi: 10.1186/1471-2105-6-53. BMC Bioinformatics. 2005. PMID: 15762985 Free PMC article.
-
Cross-sectional dating of novel haplotypes of HERV-K 113 and HERV-K 115 indicate these proviruses originated in Africa before Homo sapiens.Mol Biol Evol. 2009 Nov;26(11):2617-26. doi: 10.1093/molbev/msp180. Epub 2009 Aug 10. Mol Biol Evol. 2009. PMID: 19666991 Free PMC article.
-
Genomic divergences among cattle, dog and human estimated from large-scale alignments of genomic sequences.BMC Genomics. 2006 Jun 7;7:140. doi: 10.1186/1471-2164-7-140. BMC Genomics. 2006. PMID: 16759380 Free PMC article.
References
-
- Kimura M. The Neutral Theory of Molecular Evolution. Cambridge, U.K.: Cambridge Univ. Press; 1983.
-
- Nei M, Kumar S. Molecular Evolution and Phylogenetics. New York: Oxford Univ. Press; 2000.
-
- Li W-H, Tanimura M. Nature (London) 1987;326:93–96. - PubMed
-
- Britten R J. Science. 1986;231:1393–1398. - PubMed
-
- Wolfe K H, Sharp P M, Li W-H. Nature (London) 1989;337:283–285. - PubMed
Publication types
MeSH terms
Grants and funding
LinkOut - more resources
Full Text Sources
Other Literature Sources
