Using a dynamic hydrology model to predict mosquito abundances in flood and swamp water
- PMID: 11749741
- PMCID: PMC2730265
- DOI: 10.3201/eid0801.010049
Using a dynamic hydrology model to predict mosquito abundances in flood and swamp water
Abstract
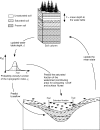
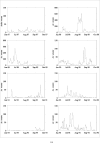
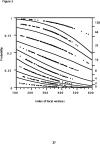
We modeled surface wetness at high resolution, using a dynamic hydrology model, to predict flood and swamp water mosquito abundances. Historical meteorologic data, as well as topographic, soil, and vegetation data, were used to model surface wetness and identify potential fresh and swamp water breeding habitats in two northern New Jersey watersheds. Surface wetness was positively associated with the subsequent abundance of the dominant floodwater mosquito species, Aedes vexans, and the swamp water species, Anopheles walkeri. The subsequent abundance of Culex pipiens, a species that breeds in polluted, eutrophic waters, was negatively correlated with local modeled surface wetness. These associations permit real-time monitoring and forecasting of these floodwater and nonfloodwater species at high spatial and temporal resolution. These predictions will enable public health agencies to institute control measures before the mosquitoes emerge as adults, when their role as transmitters of disease comes into play.
Figures


Similar articles
-
Stage and age structured Aedes vexans and Culex pipiens (Diptera: Culicidae) climate-dependent matrix population model.Theor Popul Biol. 2013 Feb;83:82-94. doi: 10.1016/j.tpb.2012.08.002. Epub 2012 Aug 24. Theor Popul Biol. 2013. PMID: 22971424
-
Different responses of two floodwater mosquito species, Aedes vexans and Ochlerotatus sticticus (Diptera: Culicidae), to larval habitat drying.J Vector Ecol. 2006 Jun;31(1):123-8. doi: 10.3376/1081-1710(2006)31[123:drotfm]2.0.co;2. J Vector Ecol. 2006. PMID: 16859100
-
Characterisation of larval habitats, species composition and factors associated with the seasonal abundance of mosquito fauna in Gezira, Sudan.Infect Dis Poverty. 2017 Feb 8;6(1):23. doi: 10.1186/s40249-017-0242-1. Infect Dis Poverty. 2017. PMID: 28173839 Free PMC article.
-
Review: artificial container-breeding mosquitoes and cemeteries: a perfect match.Trop Med Int Health. 2007 Feb;12(2):299-313. doi: 10.1111/j.1365-3156.2006.01781.x. Trop Med Int Health. 2007. PMID: 17300639 Review.
-
Bionomics of autogenous mosquitoes.Annu Rev Entomol. 1971;16:231-48. doi: 10.1146/annurev.en.16.010171.001311. Annu Rev Entomol. 1971. PMID: 4396449 Review. No abstract available.
Cited by
-
Effects of soil on the development, survival, and oviposition of Culex quinquefasciatus (Diptera: Culicidae) mosquitoes.Parasit Vectors. 2024 Mar 24;17(1):154. doi: 10.1186/s13071-024-06202-y. Parasit Vectors. 2024. PMID: 38523287 Free PMC article.
-
Co-occurrence probabilities between mosquito vectors of West Nile and Eastern equine encephalitis viruses using Markov Random Fields (MRFcov).Parasit Vectors. 2023 Jan 10;16(1):10. doi: 10.1186/s13071-022-05530-1. Parasit Vectors. 2023. PMID: 36627717 Free PMC article.
-
Climate Change Drives the Transmission and Spread of Vector-Borne Diseases: An Ecological Perspective.Biology (Basel). 2022 Nov 7;11(11):1628. doi: 10.3390/biology11111628. Biology (Basel). 2022. PMID: 36358329 Free PMC article.
-
A Process-based Model with Temperature, Water, and Lab-derived Data Improves Predictions of Daily Culex pipiens/restuans Mosquito Density.J Med Entomol. 2022 Nov 16;59(6):1947-1959. doi: 10.1093/jme/tjac127. J Med Entomol. 2022. PMID: 36203397 Free PMC article.
-
Spatial patterns of West Nile virus distribution in the Volgograd region of Russia, a territory with long-existing foci.PLoS Negl Trop Dis. 2022 Jan 31;16(1):e0010145. doi: 10.1371/journal.pntd.0010145. eCollection 2022 Jan. PLoS Negl Trop Dis. 2022. PMID: 35100289 Free PMC article.
References
-
- Wood BL, Beck LR, Washino RK, Palchick SM, Sebesta PD. Spectral and spatial characterization of rice field mosquito habitat. Int J Remote Sens. 1991;12:621–6. 10.1080/01431169108929676 - DOI
-
- Wood BL, Beck LR, Washino RK, Hibbard KA, Salute JS. Estimating high mosquito-producing rice fields using spectral and spatial data. Int J Remote Sens. 1992;13:2813–26. 10.1080/01431169208904083 - DOI
-
- Washino RK, Wood BL. Application of remote sensing to arthropod vector surveillance and control. Am J Trop Med Hyg. 1994;5:134–44. - PubMed
Publication types
MeSH terms
Substances
LinkOut - more resources
Full Text Sources
Medical
