

Fluctuating synaptic conductances recreate in vivo-like activity in neocortical neurons
- PMID: 11744242
- PMCID: PMC3320220
- DOI: 10.1016/s0306-4522(01)00344-x
Fluctuating synaptic conductances recreate in vivo-like activity in neocortical neurons
Abstract
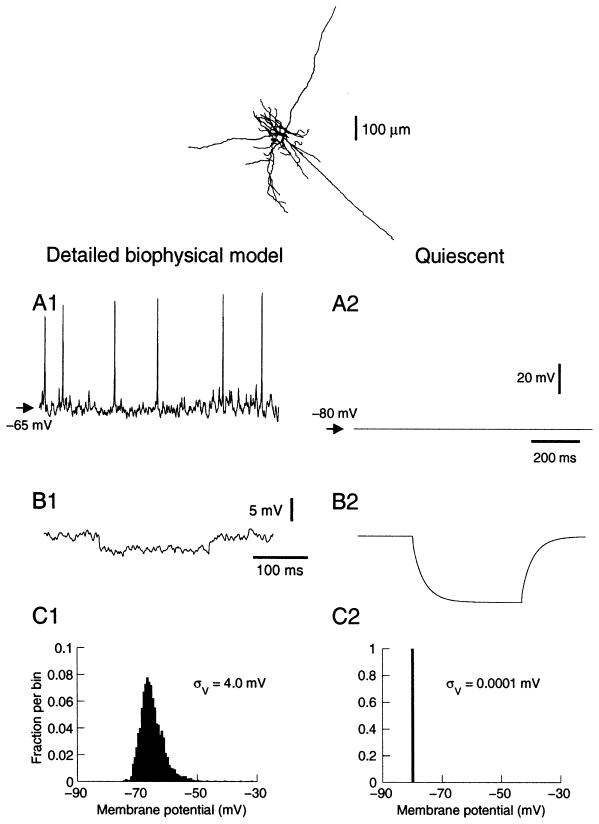
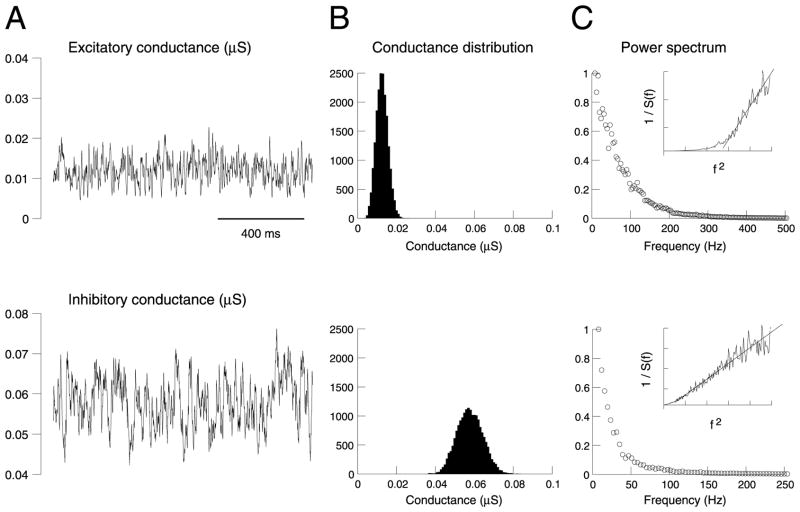
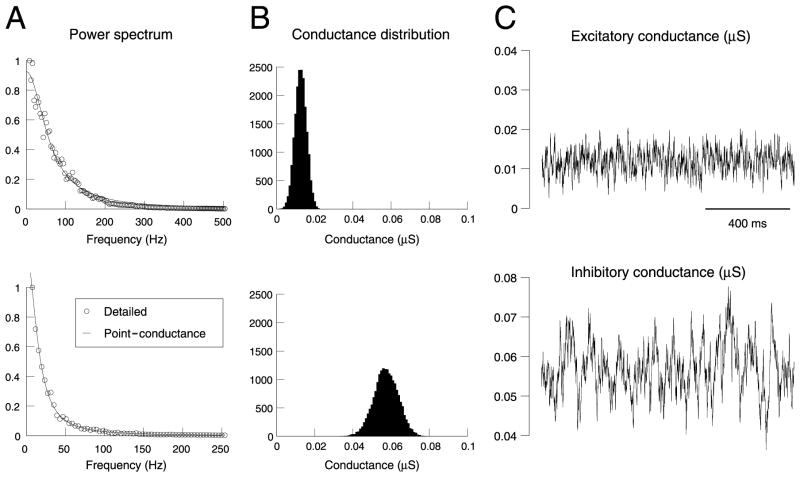
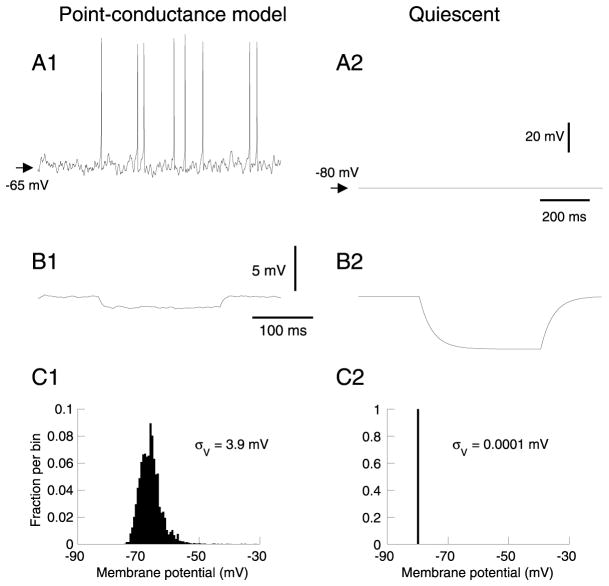
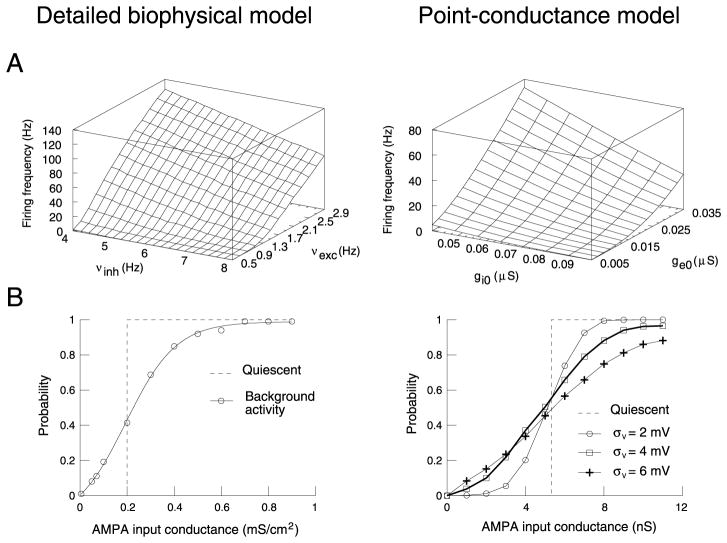
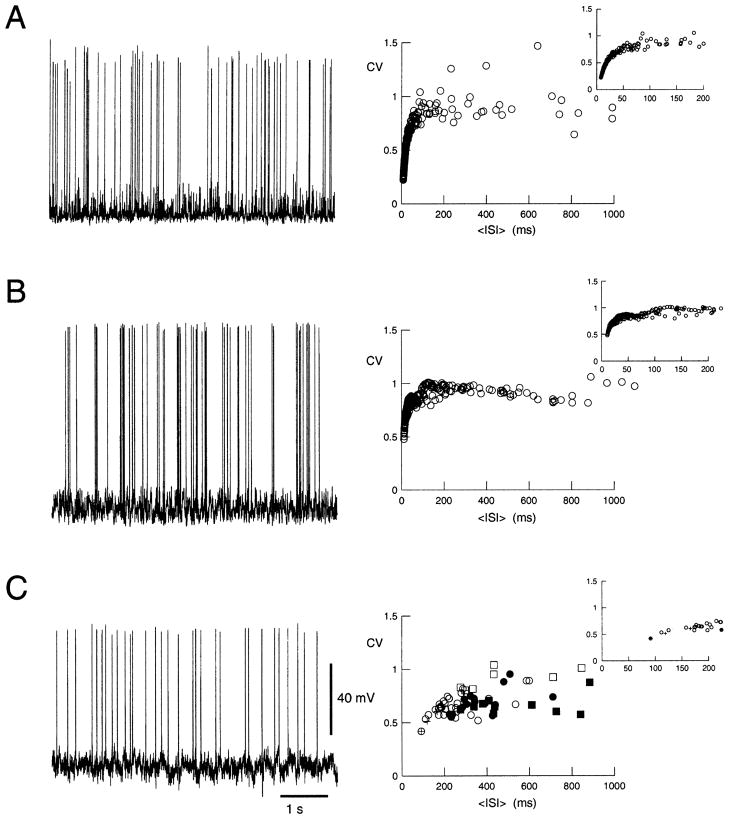
To investigate the basis of the fluctuating activity present in neocortical neurons in vivo, we have combined computational models with whole-cell recordings using the dynamic-clamp technique. A simplified 'point-conductance' model was used to represent the currents generated by thousands of stochastically releasing synapses. Synaptic activity was represented by two independent fast glutamatergic and GABAergic conductances described by stochastic random-walk processes. An advantage of this approach is that all the model parameters can be determined from voltage-clamp experiments. We show that the point-conductance model captures the amplitude and spectral characteristics of the synaptic conductances during background activity. To determine if it can recreate in vivo-like activity, we injected this point-conductance model into a single-compartment model, or in rat prefrontal cortical neurons in vitro using dynamic clamp. This procedure successfully recreated several properties of neurons intracellularly recorded in vivo, such as a depolarized membrane potential, the presence of high-amplitude membrane potential fluctuations, a low-input resistance and irregular spontaneous firing activity. In addition, the point-conductance model could simulate the enhancement of responsiveness due to background activity. We conclude that many of the characteristics of cortical neurons in vivo can be explained by fast glutamatergic and GABAergic conductances varying stochastically.
Figures

Similar articles
-
The discharge variability of neocortical neurons during high-conductance states.Neuroscience. 2003;119(3):855-73. doi: 10.1016/s0306-4522(03)00164-7. Neuroscience. 2003. PMID: 12809706
-
Synaptic background noise controls the input/output characteristics of single cells in an in vitro model of in vivo activity.Neuroscience. 2003;122(3):811-29. doi: 10.1016/j.neuroscience.2003.08.027. Neuroscience. 2003. PMID: 14622924 Free PMC article.
-
Impact of network activity on the integrative properties of neocortical pyramidal neurons in vivo.J Neurophysiol. 1999 Apr;81(4):1531-47. doi: 10.1152/jn.1999.81.4.1531. J Neurophysiol. 1999. PMID: 10200189
-
Do neocortical pyramidal neurons display stochastic resonance?J Comput Neurosci. 2001 Jul-Aug;11(1):19-42. doi: 10.1023/a:1011200713411. J Comput Neurosci. 2001. PMID: 11524576
-
Neuronal arithmetic.Nat Rev Neurosci. 2010 Jul;11(7):474-89. doi: 10.1038/nrn2864. Nat Rev Neurosci. 2010. PMID: 20531421 Free PMC article. Review.
Cited by
-
Effective Suppression of Pathological Synchronization in Cortical Networks by Highly Heterogeneous Distribution of Inhibitory Connections.Front Comput Neurosci. 2016 Oct 18;10:109. doi: 10.3389/fncom.2016.00109. eCollection 2016. Front Comput Neurosci. 2016. PMID: 27803659 Free PMC article.
-
Outwardly rectifying tonically active GABAA receptors in pyramidal cells modulate neuronal offset, not gain.J Neurosci. 2009 Dec 2;29(48):15341-50. doi: 10.1523/JNEUROSCI.2747-09.2009. J Neurosci. 2009. PMID: 19955387 Free PMC article.
-
A neurocomputational model of stimulus-specific adaptation to oddball and Markov sequences.PLoS Comput Biol. 2011 Aug;7(8):e1002117. doi: 10.1371/journal.pcbi.1002117. Epub 2011 Aug 18. PLoS Comput Biol. 2011. PMID: 21876661 Free PMC article.
-
Cumulative latency advance underlies fast visual processing in desynchronized brain state.Proc Natl Acad Sci U S A. 2014 Jan 7;111(1):515-20. doi: 10.1073/pnas.1316166111. Epub 2013 Dec 17. Proc Natl Acad Sci U S A. 2014. PMID: 24347634 Free PMC article.
-
Intense synaptic activity enhances temporal resolution in spinal motoneurons.PLoS One. 2008 Sep 16;3(9):e3218. doi: 10.1371/journal.pone.0003218. PLoS One. 2008. PMID: 18795101 Free PMC article.
References
-
- Barrett JN. Motoneuron dendrites: role in synaptic integration. Fed Proc. 1975;34:1398–1407. - PubMed
-
- Borg-Graham LJ, Monier C, Frégnac Y. Visual input evokes transient and strong shunting inhibition in visual cortical neurons. Nature. 1998;393:369–373. - PubMed
-
- Contreras D, Destexhe A, Steriade M. Intracellular and computational characterization of the intracortical inhibitory control of synchronized thalamic inputs in vivo. J Neurophysiol. 1997;78:335–350. - PubMed
Publication types
MeSH terms
Substances
Grants and funding
LinkOut - more resources
Full Text Sources
Molecular Biology Databases
