

Multiclass cancer diagnosis using tumor gene expression signatures
- PMID: 11742071
- PMCID: PMC64998
- DOI: 10.1073/pnas.211566398
Multiclass cancer diagnosis using tumor gene expression signatures
Abstract
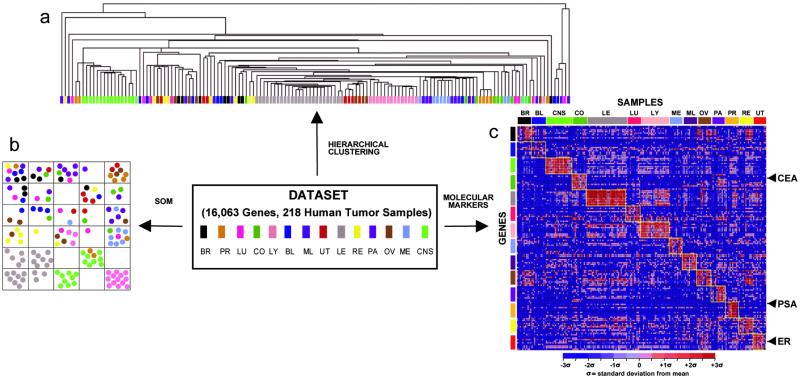
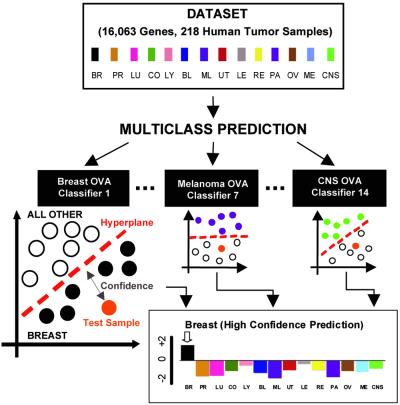
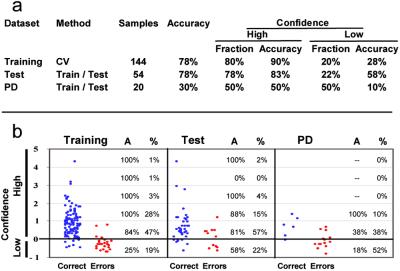
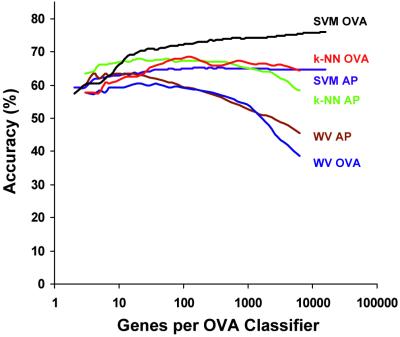
The optimal treatment of patients with cancer depends on establishing accurate diagnoses by using a complex combination of clinical and histopathological data. In some instances, this task is difficult or impossible because of atypical clinical presentation or histopathology. To determine whether the diagnosis of multiple common adult malignancies could be achieved purely by molecular classification, we subjected 218 tumor samples, spanning 14 common tumor types, and 90 normal tissue samples to oligonucleotide microarray gene expression analysis. The expression levels of 16,063 genes and expressed sequence tags were used to evaluate the accuracy of a multiclass classifier based on a support vector machine algorithm. Overall classification accuracy was 78%, far exceeding the accuracy of random classification (9%). Poorly differentiated cancers resulted in low-confidence predictions and could not be accurately classified according to their tissue of origin, indicating that they are molecularly distinct entities with dramatically different gene expression patterns compared with their well differentiated counterparts. Taken together, these results demonstrate the feasibility of accurate, multiclass molecular cancer classification and suggest a strategy for future clinical implementation of molecular cancer diagnostics.
Figures

Similar articles
-
Multiclass cancer classification and biomarker discovery using GA-based algorithms.Bioinformatics. 2005 Jun 1;21(11):2691-7. doi: 10.1093/bioinformatics/bti419. Epub 2005 Apr 6. Bioinformatics. 2005. PMID: 15814557
-
Accurate molecular classification of human cancers based on gene expression using a simple classifier with a pathological tree-based framework.Am J Pathol. 2003 Nov;163(5):1985-95. doi: 10.1016/S0002-9440(10)63557-2. Am J Pathol. 2003. PMID: 14578198 Free PMC article.
-
Multiclass molecular cancer classification by kernel subspace methods with effective kernel parameter selection.J Bioinform Comput Biol. 2005 Oct;3(5):1071-88. doi: 10.1142/s0219720005001491. J Bioinform Comput Biol. 2005. PMID: 16278948
-
Microarrays and molecular markers for tumor classification.Genome Biol. 2002;3(5):comment2005. doi: 10.1186/gb-2002-3-5-comment2005. Epub 2002 Apr 29. Genome Biol. 2002. PMID: 12049658 Free PMC article. Review.
-
Determination of tumour marker genes from gene expression data.Drug Discov Today. 2005 Mar 15;10(6):429-37. doi: 10.1016/S1359-6446(05)03393-3. Drug Discov Today. 2005. PMID: 15808822 Review.
Cited by
-
Osteoprotegerin in bone metastases: mathematical solution to the puzzle.PLoS Comput Biol. 2012;8(10):e1002703. doi: 10.1371/journal.pcbi.1002703. Epub 2012 Oct 18. PLoS Comput Biol. 2012. PMID: 23093918 Free PMC article.
-
Sildenafil Potentiates the Therapeutic Efficacy of Docetaxel in Advanced Prostate Cancer by Stimulating NO-cGMP Signaling.Clin Cancer Res. 2020 Nov 1;26(21):5720-5734. doi: 10.1158/1078-0432.CCR-20-1569. Epub 2020 Aug 26. Clin Cancer Res. 2020. PMID: 32847934 Free PMC article.
-
A computational pipeline for the development of multi-marker bio-signature panels and ensemble classifiers.BMC Bioinformatics. 2012 Dec 8;13:326. doi: 10.1186/1471-2105-13-326. BMC Bioinformatics. 2012. PMID: 23216969 Free PMC article.
-
Phosphosignature predicts dasatinib response in non-small cell lung cancer.Mol Cell Proteomics. 2012 Sep;11(9):651-68. doi: 10.1074/mcp.M111.016410. Epub 2012 May 21. Mol Cell Proteomics. 2012. PMID: 22617229 Free PMC article.
-
Improving accuracy for cancer classification with a new algorithm for genes selection.BMC Bioinformatics. 2012 Nov 13;13:298. doi: 10.1186/1471-2105-13-298. BMC Bioinformatics. 2012. PMID: 23148517 Free PMC article.
References
-
- Ramaswamy S, Osteen R T, Shulman L N. In: Clinical Oncology. Lenhard R E, Osteen R T, Gansler T, editors. Atlanta: Am. Cancer Soc.; 2001. pp. 711–719.
-
- Tomaszewski J E, LiVolsi V A. Cancer. 1999;86:2198–2200. - PubMed
-
- Connolly J L, Schnitt S J, Wang H H, Dvorak A M, Dvorak H F. In: Cancer Medicine. Holland J F, Frei E, Bast R C, Kufe D W, Morton D L, Weichselbaum R R, editors. Baltimore: Williams & Wilkins; 1997. pp. 533–555.
-
- Golub T R, Slonim D K, Tamayo P, Huard C, Gaasenbeek M, Mesirov J P, Coller H, Loh M L, Downing J R, Caligiuri M A, et al. Science. 1999;286:531–537. - PubMed
-
- Alizadeh A A, Eisen M B, Davis R E, Ma C, Lossos I S, Rosenwald A, Boldrick J C, Sabet H, Tran T, Yu X, et al. Nature (London) 2000;403:503–511. - PubMed
Publication types
MeSH terms
Substances
LinkOut - more resources
Full Text Sources
Other Literature Sources
Molecular Biology Databases
