The genetic structure of recombinant inbred mice: high-resolution consensus maps for complex trait analysis
- PMID: 11737945
- PMCID: PMC59991
- DOI: 10.1186/gb-2001-2-11-research0046
The genetic structure of recombinant inbred mice: high-resolution consensus maps for complex trait analysis
Abstract
Background: Recombinant inbred (RI) strains of mice are an important resource used to map and analyze complex traits. They have proved particularly effective in multidisciplinary genetic studies. Widespread use of RI strains has been hampered by their modest numbers and by the difficulty of combining results derived from different RI sets.
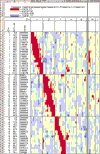
Results: We have increased the density of typed microsatellite markers two- to five-fold in each of several major RI sets that share C57BL/6 as a parental strain (AXB, BXA, BXD, BXH and CXB). A common set of 490 markers was genotyped in just over 100 RI strains. Genotypes of around 1,100 additional microsatellites in one or more RI sets were generated, collected and checked for errors. Consensus RI maps that integrate genotypes of approximately 1,600 microsatellite loci were assembled. The genomes of individual strains typically incorporate 45-55 recombination breakpoints. The collected RI set - termed the BXN set - contains approximately 5,000 breakpoints. The distribution of recombinations approximates a Poisson distribution and distances between breakpoints average about 0.5 centimorgans (cM). Locations of most breakpoints have been defined with a precision of < 2 cM. Genotypes deviate from Hardy-Weinberg equilibrium in only a small number of intervals.
Conclusions: Consensus maps derived from RI strains conform almost exactly to theoretical expectation and are close to the length predicted by the Haldane-Waddington equation (x3.6 for a 2-3 cM interval between markers). Non-syntenic associations between different chromosomes introduce predictable distortions in quantitative trait locus (QTL) datasets that can be partly corrected using two-locus correlation matrices.
Figures


Similar articles
-
Genotyping new BXD recombinant inbred mouse strains and comparison of BXD and consensus maps.Mamm Genome. 1999 Apr;10(4):335-48. doi: 10.1007/s003359900998. Mamm Genome. 1999. PMID: 10087289
-
Quantitative trait loci for novelty/stress-induced locomotor activation in recombinant inbred (RI) and recombinant congenic (RC) strains of mice.Behav Brain Res. 2005 Jun 3;161(1):113-24. doi: 10.1016/j.bbr.2005.01.013. Epub 2005 Mar 2. Behav Brain Res. 2005. PMID: 15904718
-
Parental genetic contributions in the AXB and BXA recombinant inbred mouse strains.Mamm Genome. 2002 Mar;13(3):127-33. doi: 10.1007/BF02684016. Mamm Genome. 2002. PMID: 11919682
-
Use of recombinant inbred strains to detect quantitative trait loci associated with behavior.Behav Genet. 1991 Mar;21(2):99-116. doi: 10.1007/BF01066330. Behav Genet. 1991. PMID: 2049054 Review.
-
Use of recombinant inbred strains for studying genetic determinants of responses to alcohol.Alcohol Alcohol Suppl. 1994;2:67-71. Alcohol Alcohol Suppl. 1994. PMID: 8974318 Review.
Cited by
-
Human Genes Involved in the Interaction between Host and Gut Microbiome: Regulation and Pathogenic Mechanisms.Genes (Basel). 2023 Mar 31;14(4):857. doi: 10.3390/genes14040857. Genes (Basel). 2023. PMID: 37107615 Free PMC article. Review.
-
Reproductive genomics of the mouse: implications for human fertility and infertility.Development. 2023 Feb 15;150(4):dev201313. doi: 10.1242/dev.201313. Epub 2023 Feb 13. Development. 2023. PMID: 36779988 Free PMC article.
-
Brain-iron deficiency models of restless legs syndrome.Exp Neurol. 2022 Oct;356:114158. doi: 10.1016/j.expneurol.2022.114158. Epub 2022 Jun 30. Exp Neurol. 2022. PMID: 35779614 Free PMC article. Review.
-
Cell numbers, cell ratios, and developmental plasticity in the rod pathway of the mouse retina.J Anat. 2023 Aug;243(2):204-222. doi: 10.1111/joa.13653. Epub 2022 Mar 15. J Anat. 2023. PMID: 35292986 Free PMC article. Review.
-
Identification of cyclin D1 as a major modulator of 3-nitropropionic acid-induced striatal neurodegeneration.Neurobiol Dis. 2022 Jan;162:105581. doi: 10.1016/j.nbd.2021.105581. Epub 2021 Dec 3. Neurobiol Dis. 2022. PMID: 34871739 Free PMC article.
References
-
- Taylor BA. Recombinant inbred strains. In Genetic Variants and Strains of the Laboratory Mouse, 2nd edn Edited by Lyon ML, Searle AG Oxford: Oxford University Press; 1989. pp. 773–796.
-
- Bailey DW. Strategic uses of recombinant inbred and con-genic strains in behavior genetics research. In Genetic Research Strategies for Psychogiology and Psychiatry Edited by Gershon ES, Matthysse S, Breakefield XO, Ciaranello ED New York: Plenum; 1981. pp. 189–198.
-
- Belknap JK. Effect of within-strain sample size on QTL detection and mapping using recombinant inbred strains of mice. Behav Genet. 1998;28:29–38. - PubMed
-
- Crabbe JC, Wahlsten D, Dudek BC. Genetics of mouse behavior: interactions with laboratory environment. Science. 1999;284:1670–1672. - PubMed
-
- Toth LA, Williams RW. A quantitative genetic analysis of slow-wave sleep in influenza-infected CXB recombinant inbred mice. Behav Genet. 1999;29:339–348. - PubMed
Publication types
MeSH terms
Grants and funding
LinkOut - more resources
Full Text Sources
Other Literature Sources
Molecular Biology Databases

