. 2001 Dec 3;194(11):1625-38.
doi: 10.1084/jem.194.11.1625.

Gene expression profiling of B cell chronic lymphocytic leukemia reveals a homogeneous phenotype related to memory B cells

Affiliations

Gene expression profiling of B cell chronic lymphocytic leukemia reveals a homogeneous phenotype related to memory B cells

U Klein et al. J Exp Med. .

Abstract

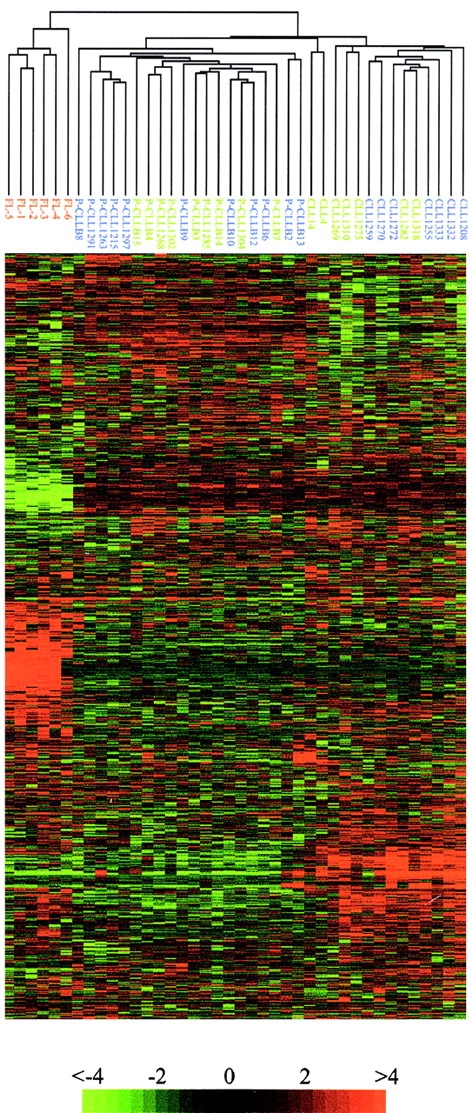
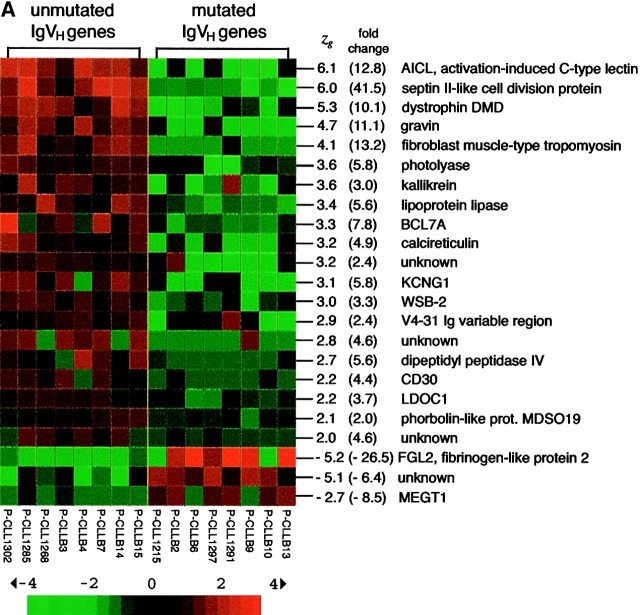
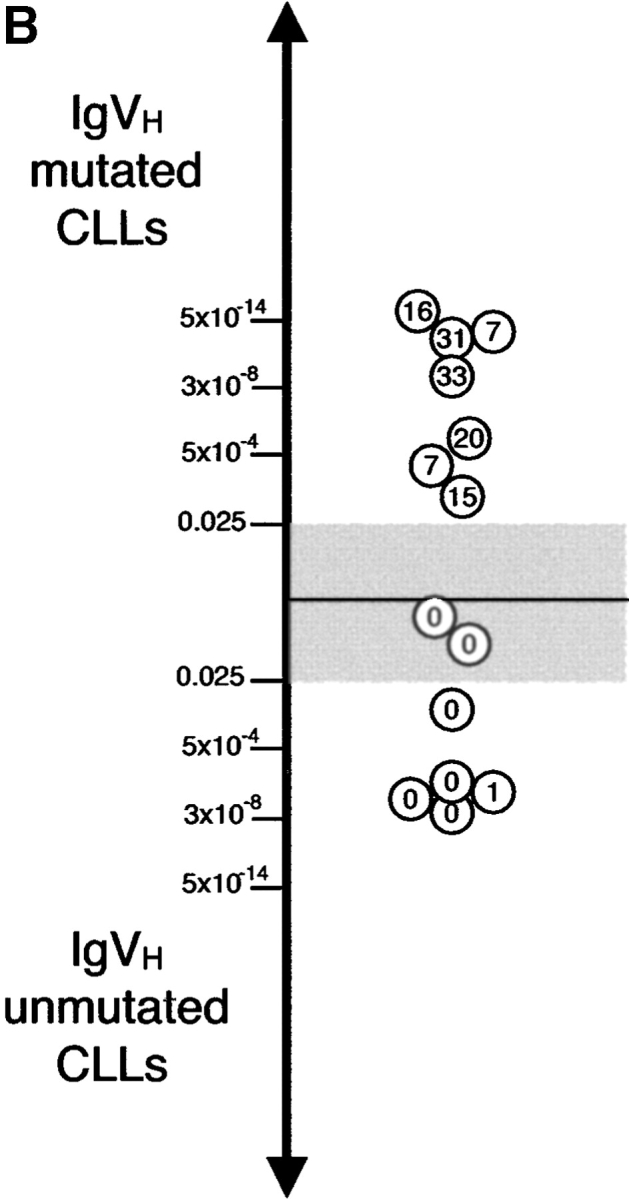
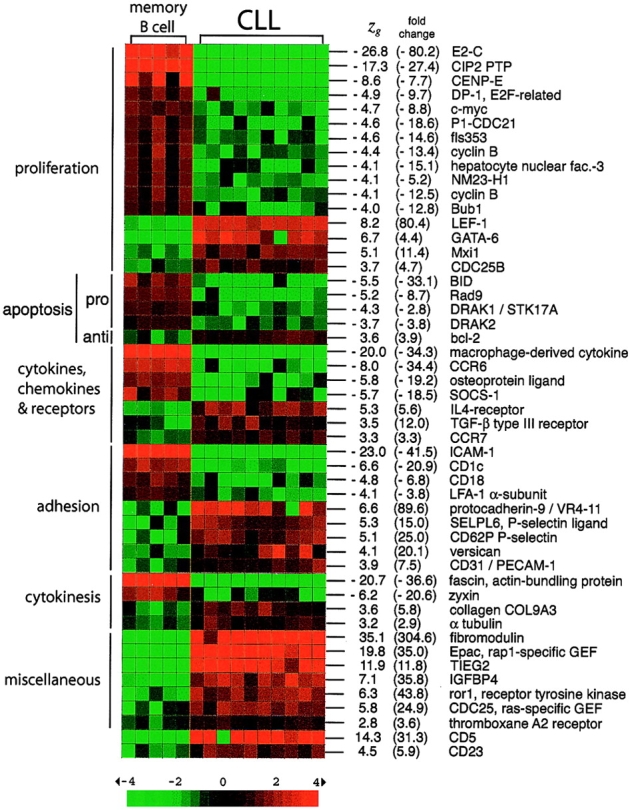
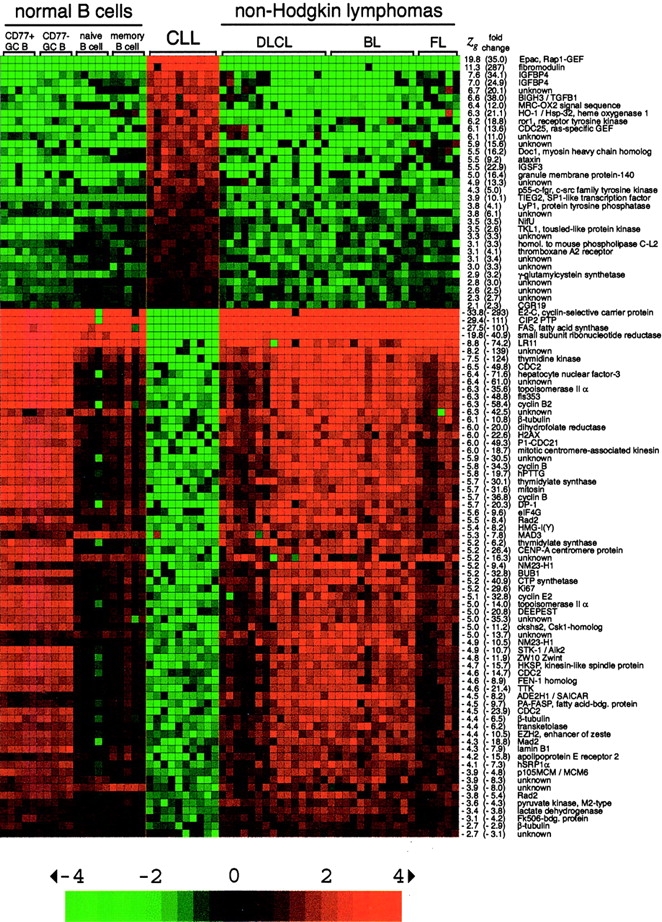
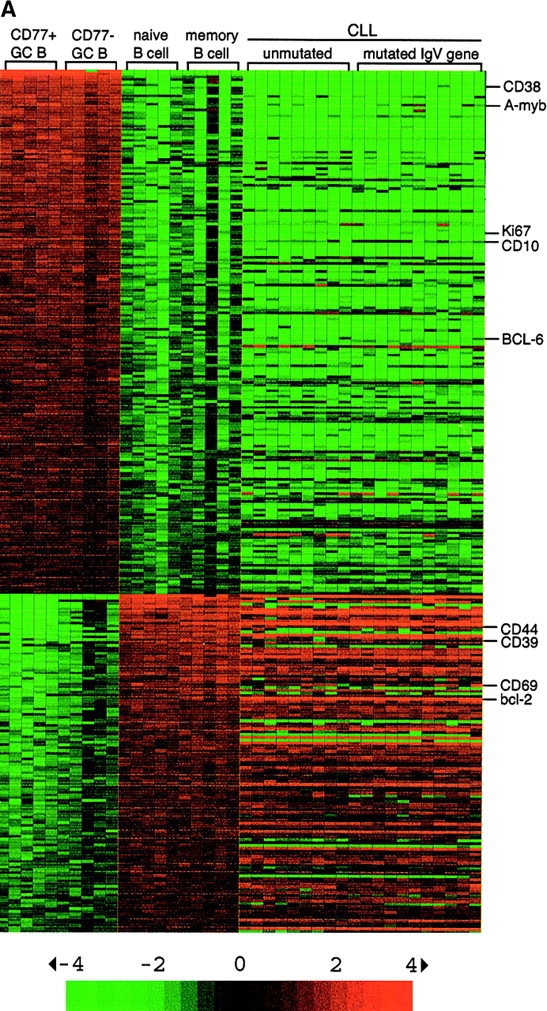
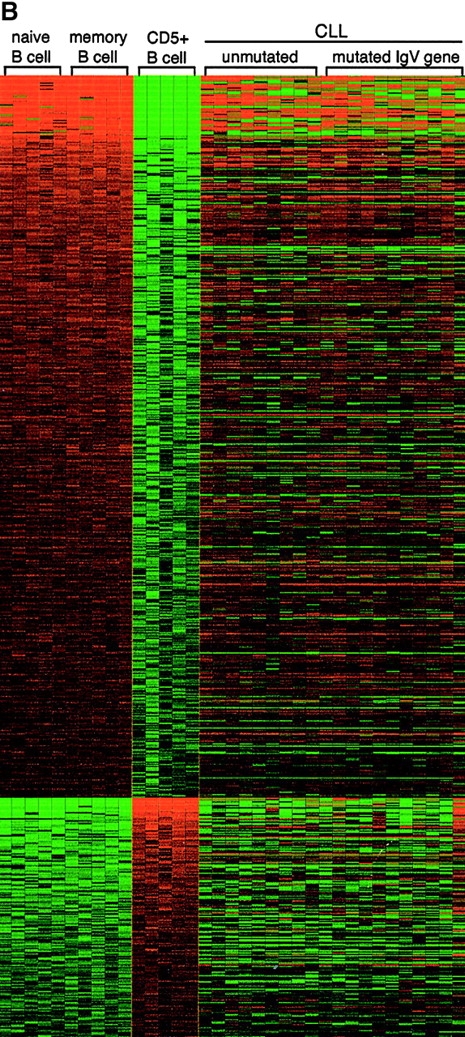
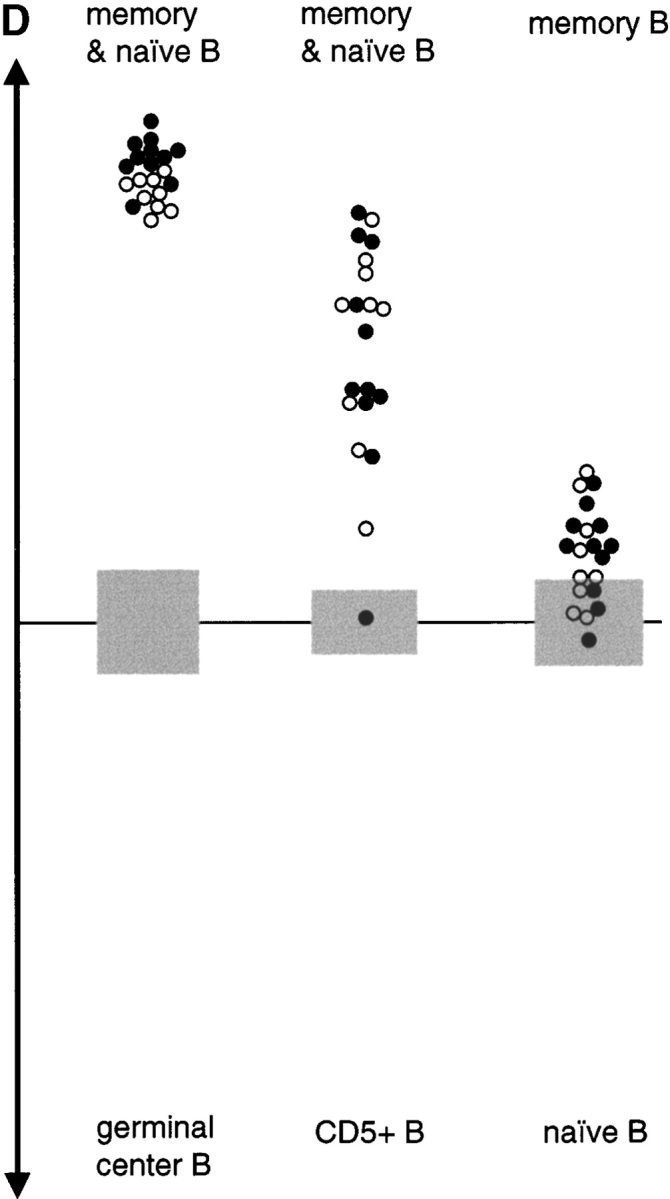
B cell-derived chronic lymphocytic leukemia (B-CLL) represents a common malignancy whose cell derivation and pathogenesis are unknown. Recent studies have shown that >50% of CLLs display hypermutated immunoglobulin variable region (IgV) sequences and a more favorable prognosis, suggesting that they may represent a distinct subset of CLLs which have transited through germinal centers (GCs), the physiologic site of IgV hypermutation. To further investigate the phenotype of CLLs, their cellular derivation and their relationship to normal B cells, we have analyzed their gene expression profiles using oligonucleotide-based DNA chip microarrays representative of approximately 12,000 genes. The results show that CLLs display a common and characteristic gene expression profile that is largely independent of their IgV genotype. Nevertheless, a restricted number of genes (<30) have been identified whose differential expression can distinguish IgV mutated versus unmutated cases and identify them in independent panels of cases. Comparison of CLL profiles with those of purified normal B cell subpopulations indicates that the common CLL profile is more related to memory B cells than to those derived from naive B cells, CD5(+) B cells, and GC centroblasts and centrocytes. Finally, this analysis has identified a subset of genes specifically expressed by CLL cells of potential pathogenetic and clinical relevance.


Figures

Figure 1.
Figure 1.
M- and UM-CLLs share a common gene expression profile. Dendrogram and matrix showing the hierarchical clustering of 2337 selected genes (see Methods) of gene expression data generated from 34 CLL (“P” indicates purified cases) and six purified FL samples. The hierarchical clustering algorithm used is based on the average-linkage method (references and 22). FL, M- and UM-CLL samples are coded by red, blue, and green respectively. The matrix below the dendrogram depicts the gene expression values of the individual samples, with columns representing individual tumor samples and rows representing individual genes ordered according to hierarchical clustering. The color scale identifies relative gene expression changes normalized by the SD, with 0 representing the mean expression level of a given gene across the panel.
Figure 2.
Figure 2.
Identification of genes differentially expressed in M- and UM-CLLs. (A) Supervised cluster analysis of M- and UM-CLLs. Eight purified M- and eight purified UM-CLL samples were examined by supervised clustering using Genes@Work (references and 24). Columns represent individual CLL samples, rows correspond to genes. Color changes within a row indicate expression levels relative to the average of the sample population. Values are quantified by the scale bar that visualizes the difference in the ζge score relative to the mean (0). Genes are ranked as described in the matrix description section. The support value for supervised analysis was chosen as n = n0 – 2, where n0 is the number of cells in the phenotype set, allowing for up to two unclustered cells per pattern in the phenotype set. Gene names and fold change are indicated; for GenBank accession no., see Supplementary Table I. Note that one of the discriminating genes is a IgV region (V4–31) that is not expressed in the CLL cases; this is due to the fact that: errors are expected for mutated IgV genes since single base pair variations affect the hybridization to oligonucleotides in the chip leading to misidentification of the IgV family member. (B) The gene expression profiles distinguishing M- from UM-CLL (classifier) can predict the M- versus UM- status of an independent panel of unpurified CLL. The classifier (23 genes; A) was applied to score 14 unpurified CLL cases (Table I), each identified by an open circle. The number of IgV gene mutations of each case is indicated within the open circle. The relatedness of each of the test samples to the two CLL subgroups is indicated by their proximity to either subgroup on the vertical axis (p-values are shown). The gray area marks the 95% confidence region, i.e. any sample with a score beyond this range can be assigned to one of the CLL subgroups with >95% confidence (see Materials and Methods). Supplemental table available at http://www.jem.org/cgi/content/full/194/11/1625/F2/DC1.
Figure 2.
Figure 2.
Identification of genes differentially expressed in M- and UM-CLLs. (A) Supervised cluster analysis of M- and UM-CLLs. Eight purified M- and eight purified UM-CLL samples were examined by supervised clustering using Genes@Work (references and 24). Columns represent individual CLL samples, rows correspond to genes. Color changes within a row indicate expression levels relative to the average of the sample population. Values are quantified by the scale bar that visualizes the difference in the ζge score relative to the mean (0). Genes are ranked as described in the matrix description section. The support value for supervised analysis was chosen as n = n0 – 2, where n0 is the number of cells in the phenotype set, allowing for up to two unclustered cells per pattern in the phenotype set. Gene names and fold change are indicated; for GenBank accession no., see Supplementary Table I. Note that one of the discriminating genes is a IgV region (V4–31) that is not expressed in the CLL cases; this is due to the fact that: errors are expected for mutated IgV genes since single base pair variations affect the hybridization to oligonucleotides in the chip leading to misidentification of the IgV family member. (B) The gene expression profiles distinguishing M- from UM-CLL (classifier) can predict the M- versus UM- status of an independent panel of unpurified CLL. The classifier (23 genes; A) was applied to score 14 unpurified CLL cases (Table I), each identified by an open circle. The number of IgV gene mutations of each case is indicated within the open circle. The relatedness of each of the test samples to the two CLL subgroups is indicated by their proximity to either subgroup on the vertical axis (p-values are shown). The gray area marks the 95% confidence region, i.e. any sample with a score beyond this range can be assigned to one of the CLL subgroups with >95% confidence (see Materials and Methods). Supplemental table available at http://www.jem.org/cgi/content/full/194/11/1625/F2/DC1.
Figure 4.
Figure 4.
Identification of genes specifically expressed in CLLs vs. memory B cells. Gene expression profiles of 10 randomly selected purified CLL cases (five UM- and five M-CLL, respectively) were compared with those of five memory cell preparations by supervised clustering using Genes@Work. Matrices and gene ranking are as in Fig. 2; the fold change is indicated. For GenBank accession no., see Supplementary Table II Genes are grouped according to putative functional categories and ranked within each category. CD5 and CD23 are indicated as internal controls. Supplemental table available at http://www.jem.org/cgi/content/full/194/11/1625/F4/DC1.
Figure 5.
Figure 5.
Identification of genes specifically expressed in CLL. Gene expression profiles of 10 randomly selected purified CLL cases (five UM- and five M-CLL, respectively) were compared with those generated from normal (CBs, CCs, naive, and memory) B cell subpopulations, purified nonHodgkin lymphoma cells (DLCL, BL, and FL), and DLCL and BL cell lines by supervised clustering using Genes@Work. Matrices and gene ranking are as in Fig. 2. Genes and fold change are indicated at the right; for GenBank accession no., see Supplementary Table III. Supplemental table available at http://www.jem.org/cgi/content/full/194/11/1625/F5/DC1
Figure 3.
Figure 3.
The gene expression profile of CLL is related to that of memory B cells. Gene expression data sets generated from 20 purified CLL cases are compared with the genes differentially expressed between CB/CC and memory/naive B cells (A), memory/naive B cells vs. CD5+ cells (B), and memory versus naive B cells (C). Genes differentially expressed between the various B cell subpopulations were identified by supervised clustering using Genes@Work. Matrices (a–c) and gene ranking are as in Fig. 2. Genes known to be differentially expressed among GC and nonGC B-cells and among naive and memory B cells, or on CLL cells (IL-4R), are indicated (references , –29). D shows the quantitative relatedness of the CLLs to the normal B cell populations as derived from panels A–C as described for Fig. 2 B. The gray area marks the 95% confidence region; the lower and upper margins of the gray area each correspond to a p-value of 0.025 (p-values decrease with increasing distance from the x-axis). Open and closed circles represent M- and UM-CLL cases, respectively.
Figure 3.
Figure 3.
The gene expression profile of CLL is related to that of memory B cells. Gene expression data sets generated from 20 purified CLL cases are compared with the genes differentially expressed between CB/CC and memory/naive B cells (A), memory/naive B cells vs. CD5+ cells (B), and memory versus naive B cells (C). Genes differentially expressed between the various B cell subpopulations were identified by supervised clustering using Genes@Work. Matrices (a–c) and gene ranking are as in Fig. 2. Genes known to be differentially expressed among GC and nonGC B-cells and among naive and memory B cells, or on CLL cells (IL-4R), are indicated (references , –29). D shows the quantitative relatedness of the CLLs to the normal B cell populations as derived from panels A–C as described for Fig. 2 B. The gray area marks the 95% confidence region; the lower and upper margins of the gray area each correspond to a p-value of 0.025 (p-values decrease with increasing distance from the x-axis). Open and closed circles represent M- and UM-CLL cases, respectively.

Similar articles

Cited by

References

    1. Caligaris-Cappio, F., and T.J. Hamblin. 1999. B-cell chronic lymphocytic leukemia: a bird of a different feather. J. Clin. Oncol. 17:399–408. - PubMed
    1. Döhner, H., S. Stilgenbauer, K. Döhner, M. Bentz, and P. Lichter. 1999. Chromosome aberrations in B-cell chronic lymphocytic leukemia: reassessment based on molecular cytogenetic analysis. J. Mol. Med. 77:266–281. - PubMed
    1. Kipps, T.J. 1998. Chronic lymphocytic leukemia. Curr. Opin. Hematol. 5:244–253. - PubMed
    1. Dighiero, G., T. Kipps, H.W. Schroeder, N. Chiorazzi, F. Stevenson, L.E. Silberstein, F. Caligaris-Cappio, and M. Ferrarini. 1996. What is the CLL B-lymphocyte? Leuk. Lymphoma. 22:13–39. - PubMed
    1. Brezinschek, H.P., S.J. Foster, R.I. Brezinschek, T. Dörner, R. Domiati-Saad, and P.E. Lipsky. 1997. Analysis of the human VH gene repertoire. Differential effects of selection and somatic hypermutation on human peripheral CD5+/IgM+ and CD5−/IgM+ B cells. J. Clin. Invest. 99:2488–2501. - PMC - PubMed

Publication types

Substances