BADGE, Beads Array for the Detection of Gene Expression, a high-throughput diagnostic bioassay
- PMID: 11691854
- PMCID: PMC311154
- DOI: 10.1101/gr.190901
BADGE, Beads Array for the Detection of Gene Expression, a high-throughput diagnostic bioassay
Abstract
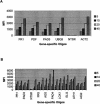
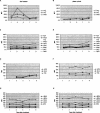
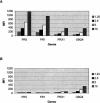
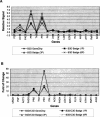
Several methods are presently available for gene expression analysis. However, few of them are suitable for detection of moderate numbers of genes in thousands of samples with high speed and low cost. There is great demand for such a method for use in diagnostics and screening. To address this need, we have developed an assay for gene expression analysis using microspheres and a fluidic instrument made by Luminex. The assay is named Beads Array for the Detection of Gene Expression (BADGE). BADGE can monitor up to 100 genes in a single reaction, and it takes only 1 h to hybridize and <20 sec to read the results of all 100 genes in a sample for the detection process. For the genes detected in five independent replicate experiments, the standard deviation was <35% of the mean. We have monitored multiple pathogenesis-related genes simultaneously in chemical-treated and control Arabidopsis samples employing the BADGE assay. The data were compared with those obtained from an established technology, Affymetrix GeneChip. The changes in expression profiles were very similar. Our study showed that the BADGE assay was capable of profiling expression of multiple genes at affordable cost and rapid speed.
Figures


Similar articles
-
Applications of Luminex xMAP technology for rapid, high-throughput multiplexed nucleic acid detection.Clin Chim Acta. 2006 Jan;363(1-2):71-82. doi: 10.1016/j.cccn.2005.06.023. Epub 2005 Aug 15. Clin Chim Acta. 2006. PMID: 16102740 Free PMC article. Review.
-
Genome-wide identification and testing of superior reference genes for transcript normalization in Arabidopsis.Plant Physiol. 2005 Sep;139(1):5-17. doi: 10.1104/pp.105.063743. Plant Physiol. 2005. PMID: 16166256 Free PMC article.
-
Design of a microsphere-based high-throughput gene expression assay to determine estrogenic potential.Environ Health Perspect. 2005 Sep;113(9):1164-71. doi: 10.1289/ehp.7843. Environ Health Perspect. 2005. PMID: 16140622 Free PMC article.
-
An alternative method to amplify RNA without loss of signal conservation for expression analysis with a proteinase DNA microarray in the ArrayTube format.BMC Genomics. 2006 Jun 12;7:144. doi: 10.1186/1471-2164-7-144. BMC Genomics. 2006. PMID: 16768788 Free PMC article.
-
Tissue microarrays.Biotechniques. 2004 Jan;36(1):98-105. doi: 10.2144/04361RV01. Biotechniques. 2004. PMID: 14740491 Review.
Cited by
-
Multiplex detection of B-type natriuretic peptide, cardiac troponin I and C-reactive protein with photonic suspension array.PLoS One. 2012;7(7):e41448. doi: 10.1371/journal.pone.0041448. Epub 2012 Jul 27. PLoS One. 2012. PMID: 22848497 Free PMC article.
-
Validation and comparison of luminex multiplex cytokine analysis kits with ELISA: determinations of a panel of nine cytokines in clinical sample culture supernatants.J Reprod Immunol. 2005 Aug;66(2):175-91. doi: 10.1016/j.jri.2005.03.005. J Reprod Immunol. 2005. PMID: 16029895 Free PMC article.
-
Applications of Luminex xMAP technology for rapid, high-throughput multiplexed nucleic acid detection.Clin Chim Acta. 2006 Jan;363(1-2):71-82. doi: 10.1016/j.cccn.2005.06.023. Epub 2005 Aug 15. Clin Chim Acta. 2006. PMID: 16102740 Free PMC article. Review.
-
High-resolution analysis of DNA copy number using oligonucleotide microarrays.Genome Res. 2004 Feb;14(2):287-95. doi: 10.1101/gr.2012304. Genome Res. 2004. PMID: 14762065 Free PMC article.
-
Microsphere bead arrays and sequence validation of 5/7/9T genotypes for multiplex screening of cystic fibrosis polymorphisms.J Mol Diagn. 2004 Nov;6(4):348-55. doi: 10.1016/S1525-1578(10)60531-4. J Mol Diagn. 2004. PMID: 15507674 Free PMC article.
References
-
- Adams MD, Kelley JM, Gocayne JD, Dubnick M, Polymeropoulos MH, Xiao H, Merril CR, Wu A, Olde B, Moreno RF, et al. Complementary DNA sequencing: Expressed sequence tags and human genome project. Science. 1991;252:1651–1656. - PubMed
-
- Adams MD, Kerlavage AR, Fleischmann RD, Fuldner RA, Bult CJ, Lee NH, Kirkness EF, Weinstock KG, Gocayne JD, White O, et al. Initial assessment of human gene diversity and expression patterns based upon 83 million nucleotides of cDNA sequence. Nature. 1995;377 (3547 suppl):3–174. - PubMed
Publication types
MeSH terms
Substances
LinkOut - more resources
Full Text Sources
Other Literature Sources
