

Regulation of replication timing in fission yeast
- PMID: 11689451
- PMCID: PMC125695
- DOI: 10.1093/emboj/20.21.6115
Regulation of replication timing in fission yeast
Abstract
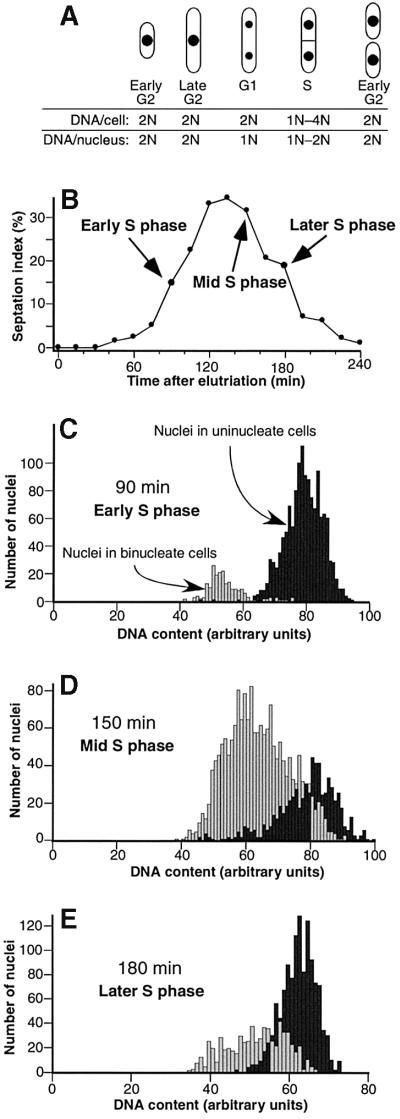
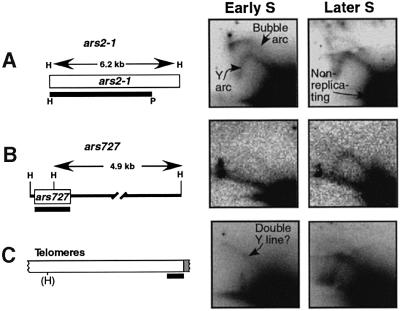
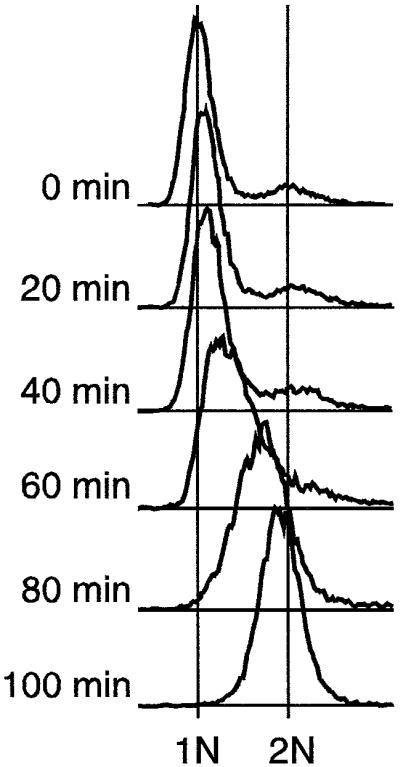
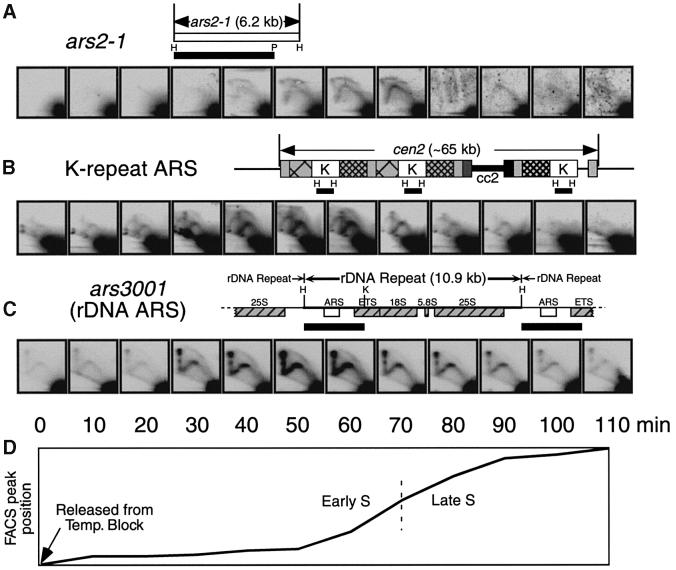
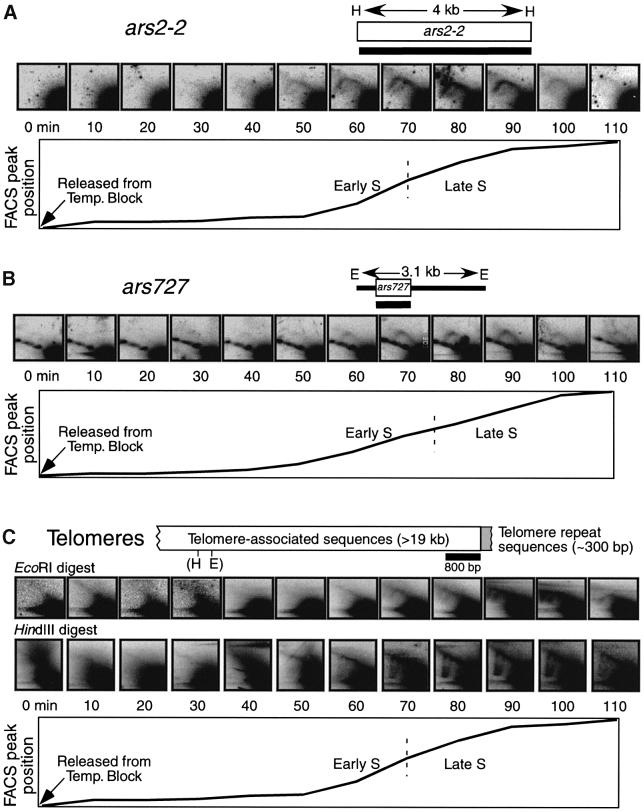
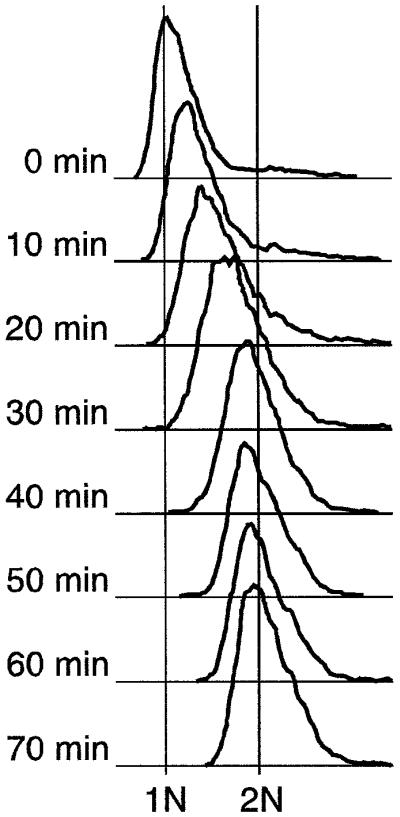
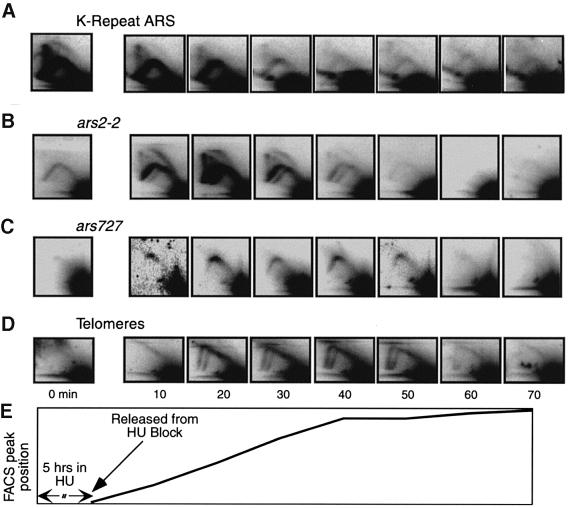
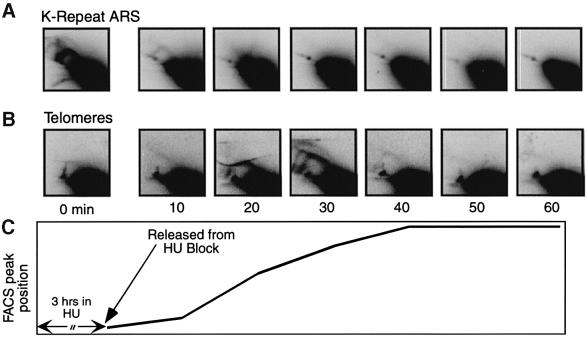
Here we report the first characterization of replication timing and its regulation in the fission yeast Schizosaccharomyces pombe. We used three different synchronization methods: centrifugal elutriation, cdc10 temperature-shift and release, and starvation for deoxyribonucleoside triphosphates (dNTPs) by treatment with hydroxyurea (HU) followed by removal of HU, to study the times when specific autonomously replicating sequence elements (ARS elements; potential replication origins) replicate during S phase. We found that individual ARS elements replicate at characteristic times, some early and some late, independently of synchronization method. In wild-type cells treated with HU, early ARS elements replicated but late ones did not. However, in HU-treated mutant cells lacking the Rad3 (similar to human ATR and ATM) or Cds1 (similar to human CHK2) checkpoint kinase, both early and late ARS elements were able to replicate. Thus under conditions of dNTP starvation the Rad3 and Cds1 kinases are needed to suppress the replication of normally late-replicating regions.
Figures

Similar articles
-
Checkpoint independence of most DNA replication origins in fission yeast.BMC Mol Biol. 2007 Dec 19;8:112. doi: 10.1186/1471-2199-8-112. BMC Mol Biol. 2007. PMID: 18093330 Free PMC article.
-
Replication checkpoint protein Mrc1 is regulated by Rad3 and Tel1 in fission yeast.Mol Cell Biol. 2003 Nov;23(22):8395-403. doi: 10.1128/MCB.23.22.8395-8403.2003. Mol Cell Biol. 2003. PMID: 14585996 Free PMC article.
-
Checkpoint effects and telomere amplification during DNA re-replication in fission yeast.BMC Mol Biol. 2007 Dec 21;8:119. doi: 10.1186/1471-2199-8-119. BMC Mol Biol. 2007. PMID: 18154680 Free PMC article.
-
Replication foci dynamics: replication patterns are modulated by S-phase checkpoint kinases in fission yeast.EMBO J. 2007 Mar 7;26(5):1315-26. doi: 10.1038/sj.emboj.7601538. Epub 2007 Feb 15. EMBO J. 2007. PMID: 17304223 Free PMC article.
-
Regulation of initiation of S phase, replication checkpoint signaling, and maintenance of mitotic chromosome structures during S phase by Hsk1 kinase in the fission yeast.Mol Biol Cell. 2001 May;12(5):1257-74. doi: 10.1091/mbc.12.5.1257. Mol Biol Cell. 2001. PMID: 11359920 Free PMC article.
Cited by
-
Atl1 regulates choice between global genome and transcription-coupled repair of O(6)-alkylguanines.Mol Cell. 2012 Jul 13;47(1):50-60. doi: 10.1016/j.molcel.2012.04.028. Epub 2012 May 31. Mol Cell. 2012. PMID: 22658721 Free PMC article.
-
Global profiling of DNA replication timing and efficiency reveals that efficient replication/firing occurs late during S-phase in S. pombe.PLoS One. 2007 Aug 8;2(8):e722. doi: 10.1371/journal.pone.0000722. PLoS One. 2007. PMID: 17684567 Free PMC article.
-
Mutations disrupting histone methylation have different effects on replication timing in S. pombe centromere.PLoS One. 2013 May 1;8(5):e61464. doi: 10.1371/journal.pone.0061464. Print 2013. PLoS One. 2013. PMID: 23658693 Free PMC article.
-
Smc5/6 is required for repair at collapsed replication forks.Mol Cell Biol. 2006 Dec;26(24):9387-401. doi: 10.1128/MCB.01335-06. Epub 2006 Oct 9. Mol Cell Biol. 2006. PMID: 17030601 Free PMC article.
-
Tolerance of Sir1p/origin recognition complex-dependent silencing for enhanced origin firing at HMRa.Mol Cell Biol. 2006 Mar;26(5):1955-66. doi: 10.1128/MCB.26.5.1955-1966.2006. Mol Cell Biol. 2006. PMID: 16479013 Free PMC article.
References
-
- Brewer B.J. and Fangman,W.L. (1987) The localization of replication origins on ARS plasmids in S.cerevisiae. Cell, 51, 463–471. - PubMed
-
- Brewer B.J., Sena,E.P. and Fangman,W.L. (1988) Analysis of replication intermediates by two-dimensional agarose gel electrophoresis. Cancer Cells, 6, 229–234. - PubMed
-
- Calza R.E., Eckhardt,L.A., DelGiudice,T. and Schildkraut,C.L. (1984) Changes in gene position are accompanied by a change in time of replication. Cell, 36, 689–696. - PubMed
Publication types
MeSH terms
Substances
Grants and funding
LinkOut - more resources
Full Text Sources
Molecular Biology Databases
Research Materials
Miscellaneous
