

Dendritic spine geometry is critical for AMPA receptor expression in hippocampal CA1 pyramidal neurons
- PMID: 11687814
- PMCID: PMC4229049
- DOI: 10.1038/nn736
Dendritic spine geometry is critical for AMPA receptor expression in hippocampal CA1 pyramidal neurons
Abstract
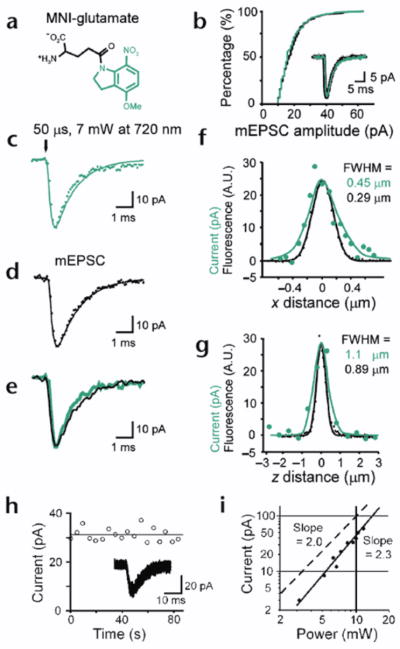
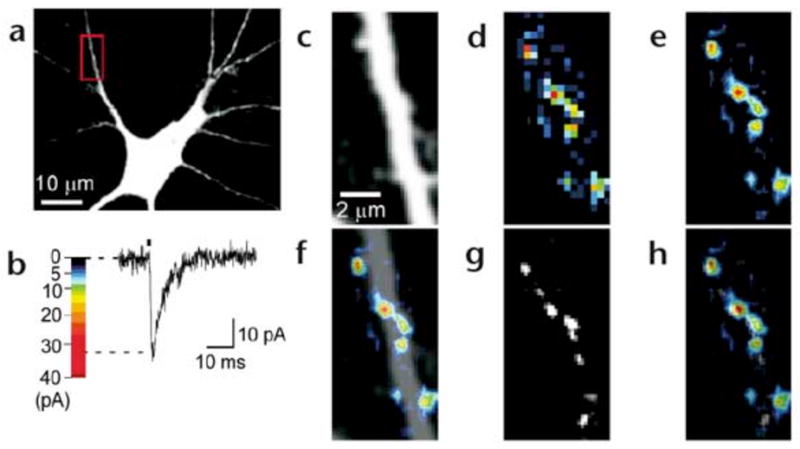
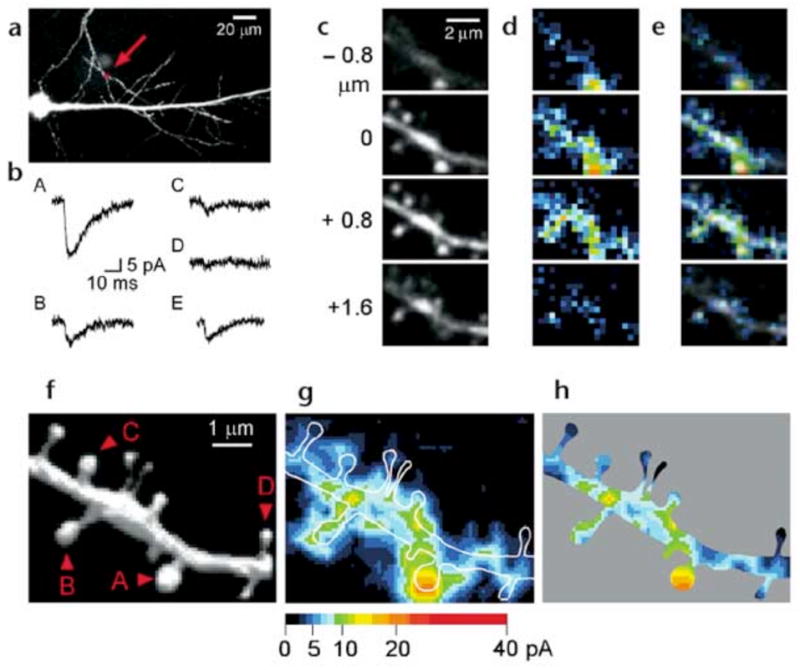
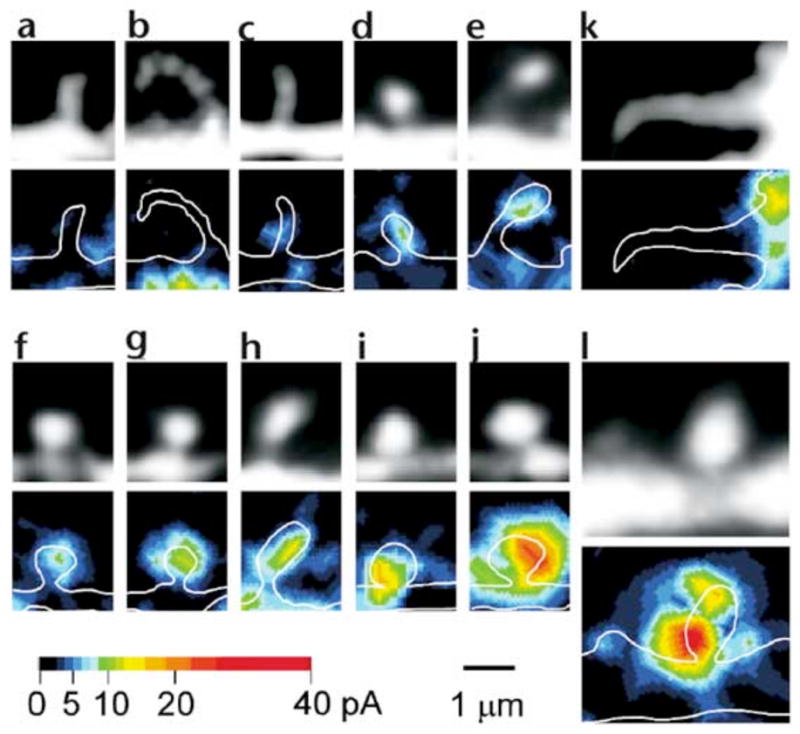
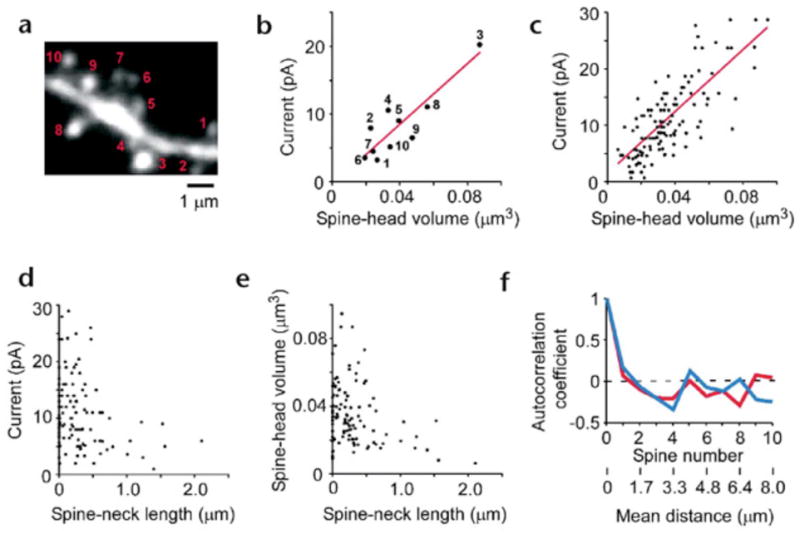
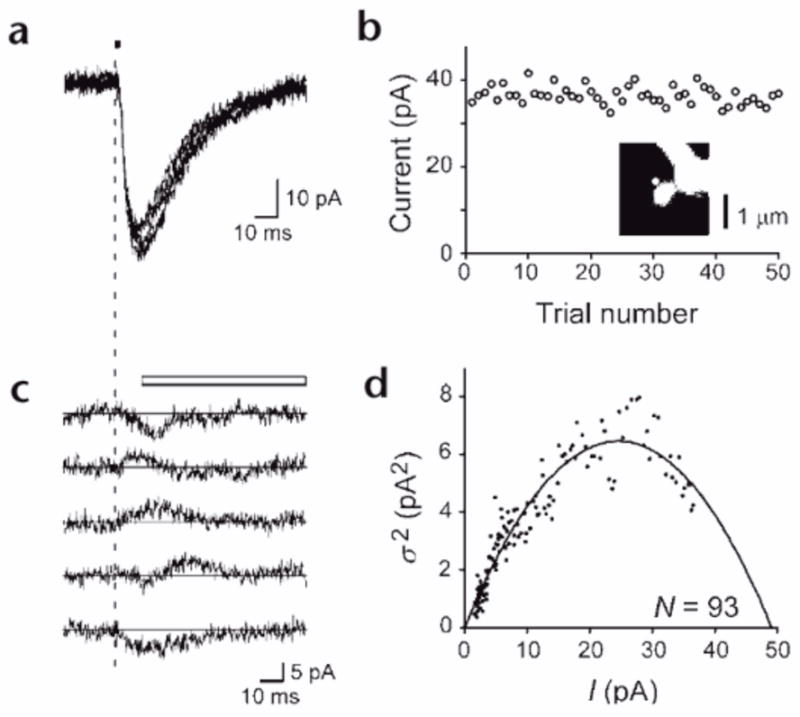
Dendritic spines serve as preferential sites of excitatory synaptic connections and are pleomorphic. To address the structure-function relationship of the dendritic spines, we used two-photon uncaging of glutamate to allow mapping of functional glutamate receptors at the level of the single synapse. Our analyses of the spines of CA1 pyramidal neurons reveal that AMPA (alpha-amino-3-hydroxy-5-methyl-4-isoxazolepropionic acid)-type glutamate receptors are abundant (up to 150/spine) in mushroom spines but sparsely distributed in thin spines and filopodia. The latter may be serving as the structural substrates of the silent synapses that have been proposed to play roles in development and plasticity of synaptic transmission. Our data indicate that distribution of functional AMPA receptors is tightly correlated with spine geometry and that receptor activity is independently regulated at the level of single spines.
Figures
Comment in
-
Illuminating the location of brain glutamate receptors.Nat Neurosci. 2001 Nov;4(11):1051-2. doi: 10.1038/nn1101-1051. Nat Neurosci. 2001. PMID: 11687808 No abstract available.
Similar articles
-
Mechanism of the distance-dependent scaling of Schaffer collateral synapses in rat CA1 pyramidal neurons.J Physiol. 2003 Apr 1;548(Pt 1):245-58. doi: 10.1113/jphysiol.2002.036376. Epub 2003 Feb 21. J Physiol. 2003. PMID: 12598591 Free PMC article.
-
Evidence for low GluR2 AMPA receptor subunit expression at synapses in the rat basolateral amygdala.J Neurochem. 2005 Sep;94(6):1728-38. doi: 10.1111/j.1471-4159.2005.03334.x. Epub 2005 Jul 25. J Neurochem. 2005. PMID: 16045445 Free PMC article.
-
Distance-dependent increase in AMPA receptor number in the dendrites of adult hippocampal CA1 pyramidal neurons.J Neurosci. 2001 Dec 1;21(23):9151-9. doi: 10.1523/JNEUROSCI.21-23-09151.2001. J Neurosci. 2001. PMID: 11717348 Free PMC article.
-
[Dendritic spine structures and functions].Nihon Shinkei Seishin Yakurigaku Zasshi. 2002 Oct;22(5):159-64. Nihon Shinkei Seishin Yakurigaku Zasshi. 2002. PMID: 12451686 Review. Japanese.
-
Modification of dendritic development.Prog Brain Res. 2002;136:135-43. doi: 10.1016/s0079-6123(02)36013-8. Prog Brain Res. 2002. PMID: 12143377 Review.
Cited by
-
Synaptic pruning in the female hippocampus is triggered at puberty by extrasynaptic GABAA receptors on dendritic spines.Elife. 2016 May 2;5:e15106. doi: 10.7554/eLife.15106. Elife. 2016. PMID: 27136678 Free PMC article.
-
Striatopallidal Neuron NMDA Receptors Control Synaptic Connectivity, Locomotor, and Goal-Directed Behaviors.J Neurosci. 2016 May 4;36(18):4976-92. doi: 10.1523/JNEUROSCI.2717-15.2016. J Neurosci. 2016. PMID: 27147651 Free PMC article.
-
Stable but not rigid: Chronic in vivo STED nanoscopy reveals extensive remodeling of spines, indicating multiple drivers of plasticity.Sci Adv. 2021 Jun 9;7(24):eabf2806. doi: 10.1126/sciadv.abf2806. Print 2021 Jun. Sci Adv. 2021. PMID: 34108204 Free PMC article.
-
Pre- and postsynaptic nanostructures increase in size and complexity after induction of long-term potentiation.iScience. 2023 Dec 7;27(1):108679. doi: 10.1016/j.isci.2023.108679. eCollection 2024 Jan 19. iScience. 2023. PMID: 38213627 Free PMC article.
-
Relative Contributions of Specific Activity Histories and Spontaneous Processes to Size Remodeling of Glutamatergic Synapses.PLoS Biol. 2016 Oct 24;14(10):e1002572. doi: 10.1371/journal.pbio.1002572. eCollection 2016 Oct. PLoS Biol. 2016. PMID: 27776122 Free PMC article.
References
-
- Bliss TV, Collingridge GL. A synaptic model of memory: long-term potentiation in the hippocampus. Nature. 1993;361:31–39. - PubMed
-
- Malenka RC, Nicoll RA. Long-term potentiation—a decade of progress? Science. 1999;285:1870–1874. - PubMed
-
- Ziff EB. Enlightening the postsynaptic density. Neuron. 1997;19:1163–1174. - PubMed
Publication types
MeSH terms
Substances
Grants and funding
LinkOut - more resources
Full Text Sources
Other Literature Sources
Miscellaneous
