

Thrombospondin-1 suppresses spontaneous tumor growth and inhibits activation of matrix metalloproteinase-9 and mobilization of vascular endothelial growth factor
- PMID: 11606713
- PMCID: PMC60080
- DOI: 10.1073/pnas.171460498
Thrombospondin-1 suppresses spontaneous tumor growth and inhibits activation of matrix metalloproteinase-9 and mobilization of vascular endothelial growth factor
Abstract
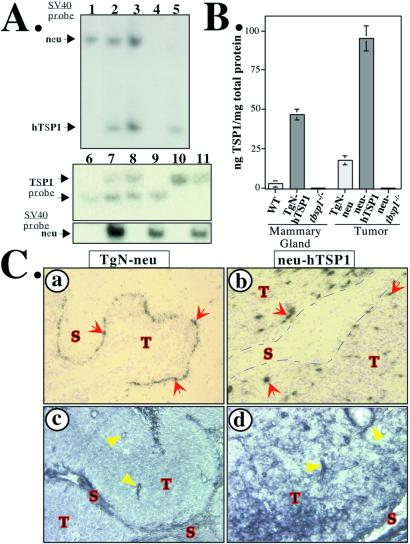
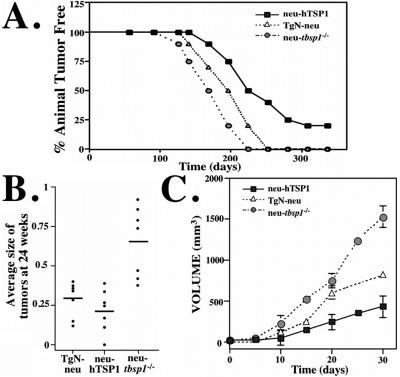
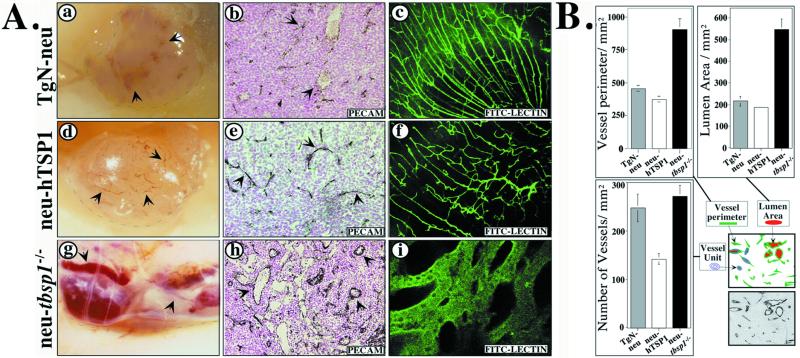
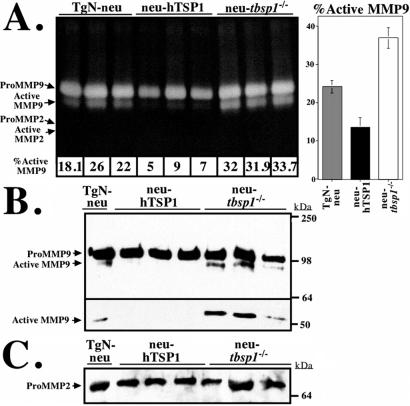
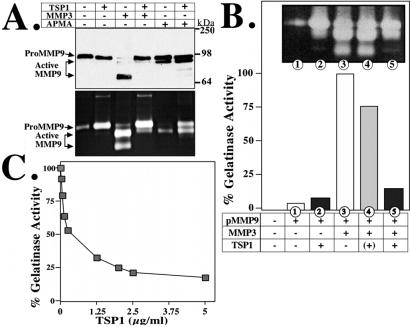
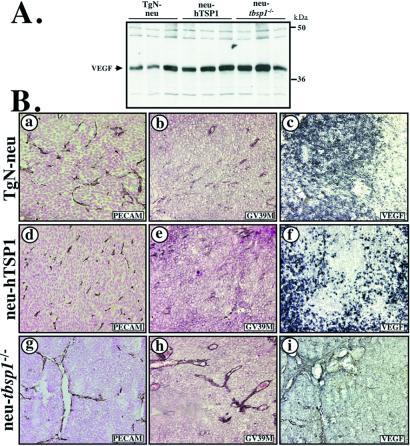
Growth of tumors and metastasis are processes known to require neovascularization. To ascertain the participation of the endogenous angiogenic inhibitor thrombospondin-1 (TSP1) in tumor progression, we generated mammary tumor-prone mice that either lack, or specifically overexpress, TSP1 in the mammary gland. Tumor burden and vasculature were significantly increased in TSP1-deficient animals, and capillaries within the tumor appeared distended and sinusoidal. In contrast, TSP1 overexpressors showed delayed tumor growth or lacked frank tumor development (20% of animals); tumor capillaries showed reduced diameter and were less frequent. Interestingly, absence of TSP1 resulted in increased association of vascular endothelial growth factor (VEGF) with its receptor VEGFR2 and higher levels of active matrix metalloproteinase-9 (MMP9), a molecule previously shown to facilitate both angiogenesis and tumor invasion. In vitro, enzymatic activation of proMMP9 was suppressed by TSP1. Together these results argue for a protective role of endogenous inhibitors of angiogenesis in tumor growth and implicate TSP1 in the in vivo regulation of metalloproteinase-9 activation and VEGF signaling.
Figures
Similar articles
-
SiRNA-mediated inhibition of vascular endothelial growth factor severely limits tumor resistance to antiangiogenic thrombospondin-1 and slows tumor vascularization and growth.Cancer Res. 2003 Jul 15;63(14):3919-22. Cancer Res. 2003. PMID: 12873985
-
Expression of the angiogenesis markers vascular endothelial growth factor-A, thrombospondin-1, and platelet-derived endothelial cell growth factor in human sporadic adrenocortical tumors: correlation with genotypic alterations.J Clin Endocrinol Metab. 2000 Dec;85(12):4734-41. doi: 10.1210/jcem.85.12.7012. J Clin Endocrinol Metab. 2000. PMID: 11134136
-
Thrombospondin-1 induces endothelial cell apoptosis and inhibits angiogenesis by activating the caspase death pathway.J Vasc Res. 2000 May-Jun;37(3):209-18. doi: 10.1159/000025733. J Vasc Res. 2000. PMID: 10859480
-
Thrombospondin-1, PECAM-1, and regulation of angiogenesis.Histol Histopathol. 1999 Jan;14(1):285-94. doi: 10.14670/HH-14.285. Histol Histopathol. 1999. PMID: 9987673 Review.
-
Regulation of tumor growth and metastasis by thrombospondin-1.FASEB J. 1996 Aug;10(10):1183-91. FASEB J. 1996. PMID: 8751720 Review.
Cited by
-
Thrombospondin-1 in urological cancer: pathological role, clinical significance, and therapeutic prospects.Int J Mol Sci. 2013 Jun 7;14(6):12249-72. doi: 10.3390/ijms140612249. Int J Mol Sci. 2013. PMID: 23749112 Free PMC article. Review.
-
Cyclin D1 regulates cellular migration through the inhibition of thrombospondin 1 and ROCK signaling.Mol Cell Biol. 2006 Jun;26(11):4240-56. doi: 10.1128/MCB.02124-05. Mol Cell Biol. 2006. PMID: 16705174 Free PMC article.
-
E2F-1 directly regulates thrombospondin 1 expression.PLoS One. 2010 Oct 15;5(10):e13442. doi: 10.1371/journal.pone.0013442. PLoS One. 2010. PMID: 20976175 Free PMC article.
-
Role of thrombospondin‑1 and thrombospondin‑2 in cardiovascular diseases (Review).Int J Mol Med. 2020 May;45(5):1275-1293. doi: 10.3892/ijmm.2020.4507. Epub 2020 Feb 20. Int J Mol Med. 2020. PMID: 32323748 Free PMC article. Review.
-
Thrombospondin-1 repression is mediated via distinct mechanisms in fibroblasts and epithelial cells.Oncogene. 2015 May 28;34(22):2823-35. doi: 10.1038/onc.2014.228. Epub 2014 Aug 11. Oncogene. 2015. PMID: 25109329 Free PMC article.
References
Publication types
MeSH terms
Substances
Grants and funding
LinkOut - more resources
Full Text Sources
Other Literature Sources
Molecular Biology Databases
Miscellaneous
