. 2001 Oct 1;21(19):7848-58.
doi: 10.1523/JNEUROSCI.21-19-07848.2001.

Proprioceptive information from the pinna provides somatosensory input to cat dorsal cochlear nucleus

Affiliations

Proprioceptive information from the pinna provides somatosensory input to cat dorsal cochlear nucleus

P O Kanold et al. J Neurosci. .

Abstract

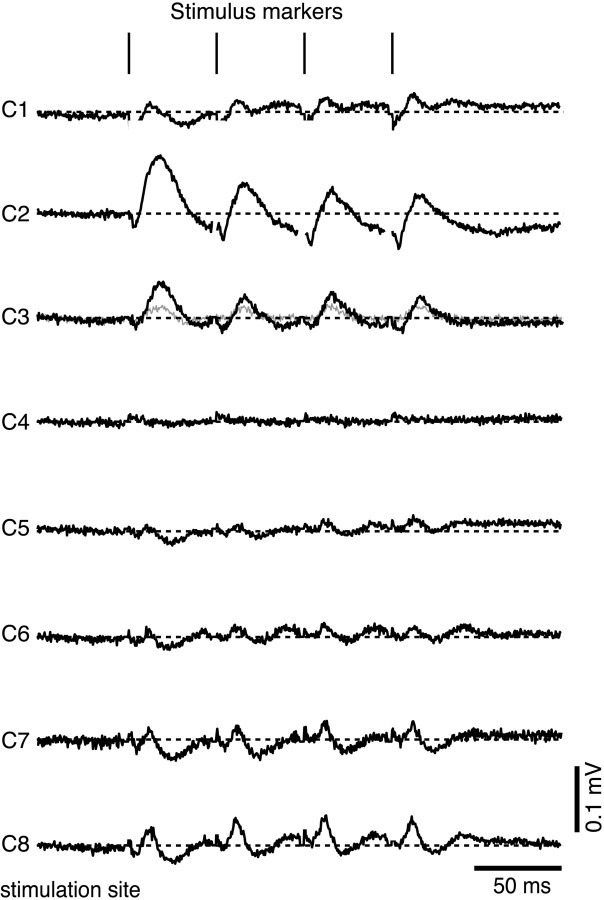
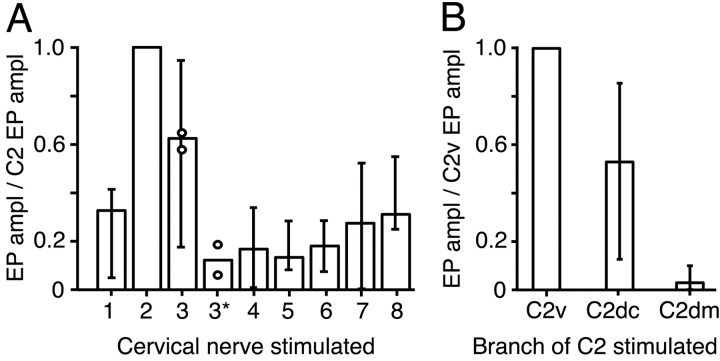
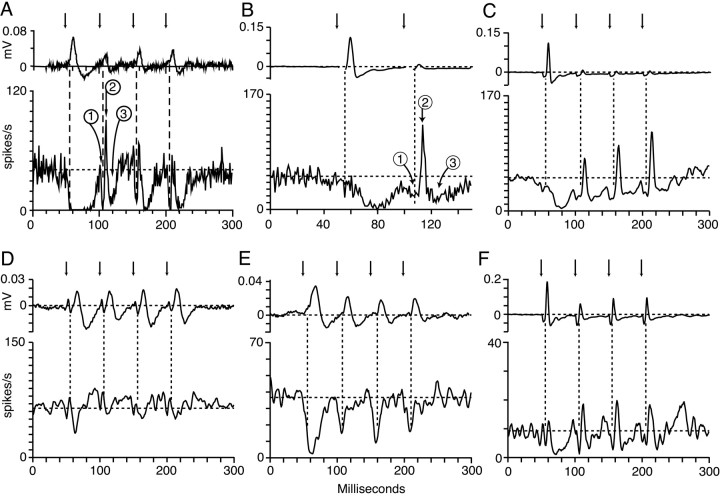
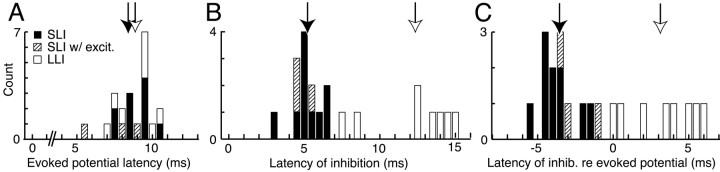
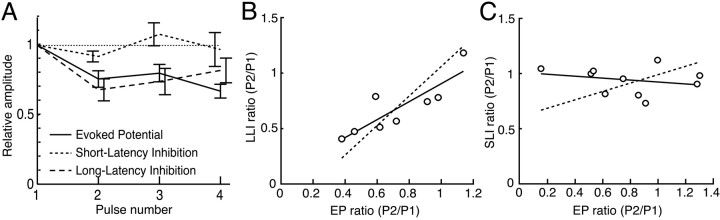
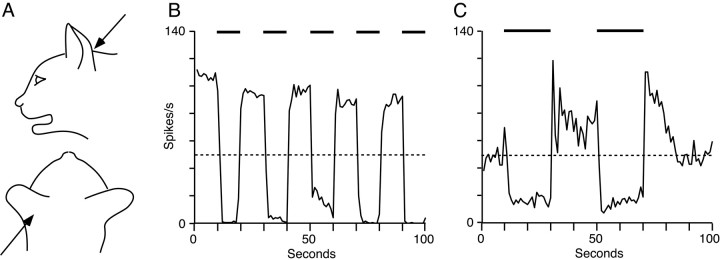
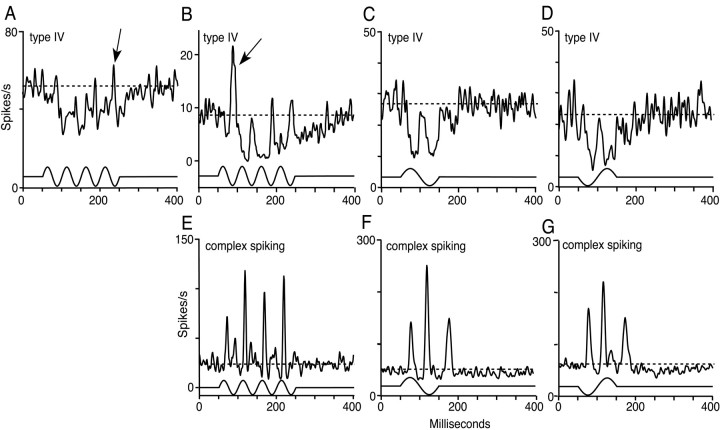
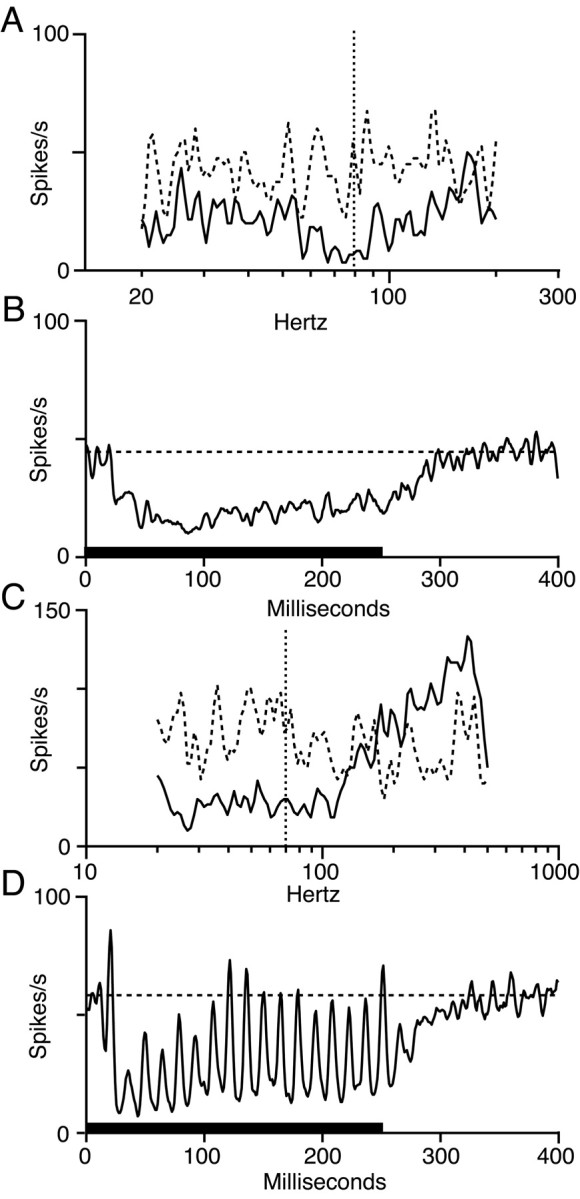
The dorsal cochlear nucleus (DCN) is a second-order auditory structure that also receives nonauditory information, including somatosensory inputs from the dorsal column and spinal trigeminal nuclei. Here we investigate the peripheral sources of the somatosensory inputs to DCN. Electrical stimulation was applied to cervical nerves C1-C8, branches of C2, branches of the trigeminal nerve, and hindlimb nerves. The largest evoked potentials in the DCN were produced by C2 stimulation and by stimulation of its branches that innervate the pinna. Electrical stimulation of C2 produced a pattern of inhibition and excitation of DCN principal cells comparable with that seen in previous studies with stimulation of the primary somatosensory nuclei, suggesting that the same pathway was activated. Because C2 contains both proprioceptive and cutaneous fibers, we applied peripheral somatosensory stimulation to identify the effective somatosensory modalities. Only stimuli that activate pinna muscle receptors, such as stretch or vibration of the muscles connected to the pinna, were effective in driving DCN units, whereas cutaneous stimuli such as light touch, brushing of hairs, and stretching of skin were ineffective. These results suggest that the largest somatosensory inputs to the DCN originate from muscle receptors associated with the pinna. They support the hypothesis that a role of the DCN in hearing is to coordinate pinna orientation to sounds or to support correction for the effects of pinna orientation on sound-localization cues.


Figures

Fig. 1.
Fig. 1.
EPs in DCN during 0.5 mA electrical stimulation of cervical nerves C1–C8 close to their respective dorsal root ganglia; all data are from the same preparation. The stimulation site is indicated to the left of eachtrace. The stimulus markers at the topshow the electrical shock times (50 msec interstimulus spacing). Stimulus artifacts have been partially zeroed. Eachtrace represents the average of 200 repetitions. Thegray trace in C3 shows the C3 EP after C2 had been sectioned.
Fig. 2.
Fig. 2.
Comparison of EP amplitudes from various peripheral nerves. A, EP amplitude during the first stimulus pulse for cervical nerves C1–C8 relative to the amplitude for C2 in the same cat. Data from five cats are shown, except that one cat's data for C1 and C8 were not used because of stimulus artifacts. Each bar shows the median relative EP amplitude, with the total range of the data shown by the lines. C2 stimulation always resulted in the largest EP. The open circles in the 3 and 3*columns show data from two cats in which the C3 amplitude was measured before (3) and after (3*) cutting C2. B, Relative EP amplitudes from three branches of C2 in six cats (different cats fromA, except for 1 case). C2dm was not studied in two cats. The EPs are normalized to the EP of C2v in each cat. The largest EPs are seen in branches of C2 that innervate the pinna.
Fig. 3.
Fig. 3.
Comparison of the effects on DCN type IV units (principal cells) of electrical stimulation of the MSN and C2. The stimulus consisted of four pulses applied at the times marked by thearrows at the top of each figure. In each plot, the top trace shows the EP at the recording site, and the bottom trace shows the PSTH of single-unit responses to 300–400 stimulus repetitions. No acoustic stimulus was applied, and the horizontal dashed lines in the PSTHs show the mean spontaneous rate. A, Response to stimulation of the MSN (redrawn from Davis and Young, 1997) to show the three components of the response. Components are defined in terms of their timing relative to the onset of the EP (vertical dashed lines) and are labeled with circled numbers: SLI (1), excitation (2), and LLI (3). B, Expanded version of the response to C2 stimulation shown in C, with the components labeled as in A. Inhibition dominates the response to the first pulse, but all three components can be seen for the second pulse. C–F, EP and PSTH traces for four cells from two animals showing responses to C2 stimulation. EP and PSTH traces were smoothed with a 7 msec wide triangular filter, except for A and B.
Fig. 4.
Fig. 4.
Histograms of the latencies of DCN responses to the first stimulus pulse in response to peripheral stimulation of C2. Consistent with previous results (Davis et al., 1996), latencies were measured from the stimulus pulse to the beginning of the positive-going portion of the EP (EP latency) and to the halfway point in the onset of inhibition (latency of inhibition). The beginning of the EP was defined by eye as the point at which the rapidly rising positive phase of the EP began. Usually, this was easily determined from smoothed EP traces; in noisy cases, it was set at the intersection of the mean prestimulus potential and a line fit to the rising phase of the EP. In units with both SLI and LLI, but without excitation, only the SLI latency can be measured because the transition between the two inhibitory components cannot be reliably observed (e.g., the unit shown in Fig.3E). LLI and SLI data are represented as shown in the key, with SLI units showing or not showing excitation differentiated by the degree of shading. Open arrows show the mean LLI latency, and filled arrows show the mean SLI latency, regardless of excitation. A, Stimulus pulse EP latency. The mean EP latencies are similar for SLI and LLI units (8.6 ± 1.2 vs 8.9 ± 1.2 msec; p > 0.5) but are significantly longer than with MSN stimulation (6.6 ± 0.9 msec for SLI units and 6.2 ± 0.6 msec for LLI units; bothp < 0.01) (Davis et al., 1996 and data not shown).B, Latency of inhibition relative to the stimulus pulse. Both the mean SLI latency (5.1 ± 0.9 msec) and the mean LLI latency (12.2 ± 2.8 msec) are significantly increased compared with MSN stimulation (4.1 ± 1.9 msec, p < 0.05, and 8.6 ± 2.5 msec, p < 0.01, respectively). C, Latency of inhibition relative to the EP (relative latency of inhibition) computed as the difference between the data in B and A. The mean relative latencies of inhibition for SLI units (−3.5 ± 1.3 msec) and LLI units (3.1 ± 2.3 msec) are comparable with the values for MSN stimulation (−2.5 ± 2.0 and 2.4 ± 2.5 msec, respectively; both p > 0.1).
Fig. 5.
Fig. 5.
Adaptation of the EP, SLI, and LLI amplitudes during peripheral electrical stimulation of C2. The amplitudes of the SLI and LLI are defined as the differences between the spontaneous rate and the minimum rate during the inhibitory response. When the SLI and LLI were not separated in the first pulse response (see Fig.3E), the SLI amplitude was taken at the latency of the SLI peak for the remaining pulses. A, The mean amplitudes of the EP, the SLI, and the LLI are plotted for pulses 2–4 relative to the first pulse. Error bars show SEMs forn = 13 (SLI), 10 (LLI), and 23 (EP). Mean LLI and EP amplitudes, but not SLI amplitude, are significantly smaller atpulse 2 compared with pulse 1(p < 0.01, p < 0.01, and p > 0.05, respectively). The LLI and EP remain significantly below 1 for the third pulse (p< 0.05 and p < 0.01). The EP remains significantly below 1 for the fourth pulse (p < 0.01), whereas the LLI does not (p ∼0.1). The LLI and EP amplitudes do not increase significantly from pulse 2 to pulses 3 and 4 (p > 0.2). B, LLI amplitude ratio as a function of EP amplitude ratio. These ratios are the amplitude in response to the second pulse (P2) divided by the amplitude in response to the first pulse (P1). The solid line shows the regression for the data (y = 0.10 + 0.81 * x; r = 0.86; p< 0.01). The dashed line shows the regression for MSN stimulation (y = −0.27 + 1.33 *x; r = 0.77; p< 10−6; from Davis et al., 1996).C, SLI amplitude ratio as a function of EP ratio. Thesolid line shows the regression for the data (y = 1.01 − 0.09 * x;r = 0.19; NS). The dashed line shows the regression for MSN stimulation (y = 0.61 + 0.38 * x; r = 0.21; NS; from Davis et al., 1996).
Fig. 6.
Fig. 6.
Responses of DCN neurons to stretch of the pinna muscles. A, Arrows show the direction and location of pressure manually applied to the scutiform cartilage.B, C, Responses of two type IV units (BF of 24.2 and 23.4 kHz) to manual pressure applied as inA. The plots are PSTHs of one repetition of the stimulus made with a bin width of 1 sec. Pressure was applied by the experimenter and maintained for ∼10 sec (B) and ∼20 sec (C), marked by the bars; the actual stimulus waveform was not recorded. The neuron inB was responding to continuous broadband noise ∼20 dB above threshold, and the neuron in C was firing spontaneously. The effect of the pressure was a tonic inhibition, which was maintained as long as the pressure was applied. Horizontal dashed lines show spontaneous rate. The unit inC shows increased firing after release of pressure, possibly attributable to rebound from inhibition or the acoustic effects of the experimenter's hand above the animal's head, because this unit was extremely sensitive to sound.
Fig. 7.
Fig. 7.
Responses of principal cells and complex-spiking neurons to sinusoidal pinna stretch. The top trace in each plot shows the PSTH of responses to 200–600 repetitions of the pinna-stretch waveform shown in the bottom trace. The zero and the scale of the bottom (stimulus)trace are arbitrary. Upward in thebottom trace is lateral stretch of the pinna muscles.Horizontal dashed lines in the PSTH show spontaneous rate. The zero of the top (PSTH) trace is sometimes offset to separate the traces. A–D, Responses of three type IV units (C and D are the same unit with different stimulus polarities). Arrows inA and B point to excitatory peaks.E–G, Responses of two complex-spiking neurons (F and G are the same unit with different stimulus polarities). Units in A, B,E and in C, D,F, G are each from the same track and received the same stimulus (different tracks from different experiments in the two groups). BFs are as follows: A, 14.7 kHz;B, 18.5 kHz; C, D, 23.7 kHz; E, 17.3 kHz; F, G, 25.3 kHz.
Fig. 8.
Fig. 8.
Responses of DCN type IV units to vibration applied to the belly of the muscle that pulls the pinna medially (musculus auricularis superioris). A, Average discharge rate during the 250 msec vibratory stimulus plotted versus stimulus frequency. Solid line is rate during the vibration;dashed line is spontaneous rate during the 375 msec immediately preceding the stimulus. Vertical dashed lineis at 80 Hz, the stimulus frequency of the response shown inB. Stimuli were presented once per second; each frequency was presented once. B, PSTH of 300 repetitions of an 80 Hz stimulus, same unit as in A. Heavy line on the abscissa shows the stimulus duration. C, D, Same as Aand B, except for a different unit. D is the response to 300 repetitions of a 70 Hz stimulus (dashed line in C).

Similar articles

Cited by

References

    1. Abrahams VC, Lynn B, Richmond FJ. Organization and sensory properties of small myelinated fibres in the dorsal cervical rami of the cat. J Physiol (Lond) 1984a;347:177–187. - PMC - PubMed
    1. Abrahams VC, Richmond FJ, Keane J. Projections from C2 and C3 nerves supplying muscles and skin of the cat neck: a study using transganglionic transport of horseradish peroxidase. J Comp Neurol. 1984b;230:142–154. - PubMed
    1. Bianconi R, Van Der Meulen JP. The response to vibration of the end organs of mammalian muscle spindles. J Neurophysiol. 1963;26:177–190. - PubMed
    1. Crouch JE. Text-atlas of cat anatomy. Lea & Febiger; Philadelphia: 1969.
    1. Crowe A, Matthews PBC. Further studies of static and dynamic fusimotor fibres. J Physiol (Lond) 1964;174:132–151. - PMC - PubMed

Publication types

MeSH terms