. 2001 Sep 17;154(6):1147-60.
doi: 10.1083/jcb.200101081.

An evolutionarily conserved NPC subcomplex, which redistributes in part to kinetochores in mammalian cells

Affiliations

An evolutionarily conserved NPC subcomplex, which redistributes in part to kinetochores in mammalian cells

N Belgareh et al. J Cell Biol. .

Abstract

The nuclear pore complexes (NPCs) are evolutionarily conserved assemblies that allow traffic between the cytoplasm and the nucleus. In this study, we have identified and characterized a novel human nuclear pore protein, hNup133, through its homology with the Saccharomyces cerevisiae nucleoporin scNup133. Two-hybrid screens and immunoprecipitation experiments revealed a direct and evolutionarily conserved interaction between Nup133 and Nup84/Nup107 and indicated that hNup133 and hNup107 are part of a NPC subcomplex that contains two other nucleoporins (the previously characterized hNup96 and a novel nucleoporin designated as hNup120) homologous to constituents of the scNup84 subcomplex. We further demonstrate that hNup133 and hNup107 are localized on both sides of the NPC to which they are stably associated at interphase, remain associated as part of a NPC subcomplex during mitosis, and are targeted at early stages to the reforming nuclear envelope. Throughout mitosis, a fraction of hNup133 and hNup107 localizes to the kinetochores, thus revealing an unexpected connection between structural NPCs constituents and kinetochores. Photobleaching experiments further showed that the mitotic cytoplasm contains kinetochore-binding competent hNup133 molecules and that in contrast to its stable association with the NPCs the interaction of this nucleoporin with kinetochores is dynamic.


Figures
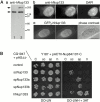
Figure 1.
Figure 1.
hNup133 localizes to the NPC and interacts with hNup107 in the yeast two-hybrid assay. (A) hNup133 localizes to the NPC. (a) Whole cell extracts from HeLa cells either nontransfected (1) or transfected with the pEGFP3-hNup133 vector (2) were analyzed by Western blot using affinity purified anti-hNup133. Molecular mass markers are in kD. (b) Immunofluorescence analysis of methanol-fixed HeLa cells using affinity purified anti-hNup133 antibodies. Nuclear DNA was stained with DAPI. (c) Fluorescence analysis of living HeLa cells expressing the GFP3-hNup133 fusion. The shape of the nucleus is revealed on the corresponding phase–contrast image. In b and c, cells were photographed in two different focal planes that reveal the discontinuous nuclear rim (left) and the punctuate staining on the surface of the nuclear envelope (middle). (B) S. cerevisiae, S. pombe, and human Nup133 interact with Nup84/Nup107 in a yeast two-hybrid assay. Strain CG194 was transformed with pASΔΔ plasmids expressing the Gal4p-BD either alone (control) or in fusion with scNup133, spNup133a, spNup133b, or hNup133 as indicated. Strain Y187 was transformed with pACTII plasmids expressing the Gal4p-AD either alone (C) or in fusion with the COOH-terminal domain of scNup84 (sc), spNup107 (sp), or hNup107 (h). Following mating, diploids expressing both plasmids were spotted onto minimum medium either lacking leucine and tryptophan (DO-LW) or lacking leucine, tryptophan, and histidine but containing 5 mM 3-aminotriazole (DO-LWH + 3AT), and the plates were incubated at 30°C for 3 d. Bars, 10 μm.
Figure 2.
Figure 2.
Immunoprecipitation of HeLa cell extracts using anti-hNup107 or anti-hNup133 antibodies. (A) Immunoprecipitation of HeLa interphasic cell extract using preimmune (−) or immune (+) sera directed against the NH2-terminal domain of hNup107 or against hNup133. Equivalent amounts of total extracts (T) and immune supernatants (S) and a fivefold equivalent of the immune pellets (P) were analyzed by immunoblot using anti-hNup133, hNup107, or the mAb414 antibody that mainly recognized p62. (B) Silver staining of immunoprecipitates from HeLa cell extracts obtained with preimmune (−) or immune (+) anti-hNup107 serum. (C and D) Same as A, using interphasic (I) or mitotic (M) extracts from HeLa cells. Note that hNup133 migrates as a more diffuse band in the mitotic extracts and that the slowly migrating forms of hNup33 are also precipitated efficiently by the anti-hNup107 antibody. (E) Interphasic (I) or mitotic (M) immune pellets obtained with affinity purified anti-hNup133 antibodies were analyzed by silver staining. In both samples, the same four prominent bands corresponding to hNup120, hNup133, hNup96, and hNup107 are present. In the immune pellet from mitotic extract, band 3 migrates as a doublet (*).
Figure 3.
Figure 3.
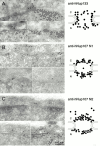
Immunolocalization of hNup133 and hNup107 on both sides of the NPC. Cryo-sections of paraformaldehyde-fixed HeLa cells were labeled with affinity purified anti-hNup133 antibody (A), anti-hNup107-N1 serum (B), or affinity purified anti-hNup107-N2 antibody (C). Typical patterns of nuclear pore labeling obtained with the various antibodies are shown. The cytoplasmic faces of the nuclear envelopes are oriented towards the top of each micrograph. Statistical analysis of the distribution of the gold particles over the NPC is presented on the right.
Figure 4.
Figure 4.
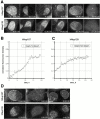
Turnover of GFP3-hNup107 and GFP3-hNup133 at the NPCs measured by FRAP. (A) Long-term FRAP experiment of NRK cells stably expressing GFP3-hNup107 or GFP3-hNup133. Half of the nucleus was bleached ∼5 h after mitosis in G1, and the fluorescence recovery was followed until the next mitosis. A confocal section focussed automatically on the lower part of the nucleus was acquired every 15 min. The images were contrast enhanced for display in a still figure. See also videos 1 and 2 available at http://www.jcb.org/content/vol154/issue6. (B and C) Ratios of background-subtracted average intensities of the bleached half versus the nonbleached half of the nuclei shown in A are plotted against time. Data points are 15-min intervals. (D) Confocal sections of an NRK cell stably expressing GFP3-hNup107 or GFP3-hNup133 before, during, and after mitosis. Bleaching and acquisition conditions were the same as in A. The images are contrast enhanced and smoothed with a 3 × 3 median filter. Time is indicated in hh:mm:ss. Bars, 5 μm.
Figure 5.
Figure 5.
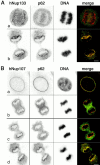
Fluorescence microscopy of HeLa cells labeled with anti-hNup133 and anti-p62 (A), anti-hNup107 and anti-p62 (B), anti-hNup133 and anti-Nup153 (C), and anti-hNup107 and anti-Nup153 (D) and stained with DAPI. Cells were fixed in formal dehyde and permeabilized with Triton X-100. Digital confocal micrographs of cells at various stages of mitosis are presented. (Merge) Superimposition of the hNup133 or hNup107 (red) and p62 or Nup153 (green) signals. hNup133 and hNup107 appear to be recruited to the chromatin periphery clearly ahead of p62 and coincident to or slightly ahead of Nup153 in anaphase (C and D, arrowheads). Arrows in C and D point to specific dot-like structures labeled with hNup133 or hNup107 but not Nup153. Bars, 5 μm.
Figure 5.
Figure 5.
Fluorescence microscopy of HeLa cells labeled with anti-hNup133 and anti-p62 (A), anti-hNup107 and anti-p62 (B), anti-hNup133 and anti-Nup153 (C), and anti-hNup107 and anti-Nup153 (D) and stained with DAPI. Cells were fixed in formal dehyde and permeabilized with Triton X-100. Digital confocal micrographs of cells at various stages of mitosis are presented. (Merge) Superimposition of the hNup133 or hNup107 (red) and p62 or Nup153 (green) signals. hNup133 and hNup107 appear to be recruited to the chromatin periphery clearly ahead of p62 and coincident to or slightly ahead of Nup153 in anaphase (C and D, arrowheads). Arrows in C and D point to specific dot-like structures labeled with hNup133 or hNup107 but not Nup153. Bars, 5 μm.
Figure 6.
Figure 6.
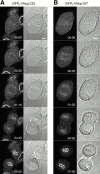
In vivo analysis of GFP3-hNup133 and GFP3-hNup107 dynamics in mitosis. (A) Four-dimensional confocal sequence of an NRK cell stably expressing GFP3-hNup133. The sequence extends from metaphase/anaphase transition to telophase. Confocal z-stacks with six slices every 1.5 μm were acquired in 5-s intervals. A single z-slice containing the best-focused GFP signal is displayed for representative time points. Left panels show GFP fluorescence to localize the nucleoporin; right panels show the simultaneously acquired DIC images to visualize the chromosomes. Due to the low signal to noise ratio in a single confocal section, fluorescence images were contrast enhanced and smoothed with a 3 × 3 median filter to remove detector shot noise. Time is indicated in mm:ss. See also video 3 available at http://www.jcb.org/content/vol154/issue6. (B) Same as in A but from a cell stably expressing GFP3-hNup107. Time interval between z-stacks is 10 s. Note the earlier diffuse recruitment of GFP3-hNup107 to the chromatin surface compared with GFP3-hNup133. See also video 4 available at http://www.jcb.org/content/vol154/issue6. Bars, 5 μm.
Figure 7.
Figure 7.
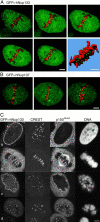
GFP3-hNup133 and GFP3-hNup107 localize to kinetochores of mitotic cells. (A and B) Live metaphase NRK cells stably expressing GFP3-hNup133 (A) or GFP3-hNup107 (B) (green) and stained with Hoechst 33342 (10 ng/mL; red) were imaged by confocal microscopy. (A) Five consecutive optical sections acquired every 1.5 μm show GFP3-hNup133 on kinetochores whose distribution on both sides of the metaphase plate is illustrated by the three- dimensional reconstruction of the entire z-stack. (B) The same localization pattern is observed in cells stably expressing GFP3-Nup107 shown in three representative optical sections. (C) HeLa cells expressing GFP3-hNup133 fixed with cold methanol and labeled with CREST serum, anti-p150Glued, and DAPI. Cells in c and d were treated for 14 h with nocodazole (5 × 10⁻⁷ M). Digital confocal micrographs of cells respectively in interphase (a), metaphase (b), prophase (c), or blocked in prometaphase (d) are presented. Bars, 5 μm.
Figure 8.
Figure 8.
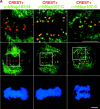
A fraction of endogenous hNup107 and hNup133 colocalizes with kinetochores in mitosis. (A) Mitotic HeLa cells were labeled with CREST serum, DAPI, and as indicated affinity purified antibodies against the NH2-terminal domain of hNup107 (α-hNup107-N) or its COOH-terminal domain (α-hNup107-C). Superimposition of the hNup107 (green) and CREST (red) signals are presented. Top, higher magnifications of the insets; bottom, DAPI. (B) HeLa cells at various stages of the cell cycle were labeled with anti-hNup133 (green), CREST serum (red), and DAPI. Digital confocal micrographs of cells respectively in interphase (a), prophase (b), metaphase (c), early anaphase (d), late anaphase (e), and telophase (f) are presented. Bars, 5 μm.
Figure 8.
Figure 8.
A fraction of endogenous hNup107 and hNup133 colocalizes with kinetochores in mitosis. (A) Mitotic HeLa cells were labeled with CREST serum, DAPI, and as indicated affinity purified antibodies against the NH2-terminal domain of hNup107 (α-hNup107-N) or its COOH-terminal domain (α-hNup107-C). Superimposition of the hNup107 (green) and CREST (red) signals are presented. Top, higher magnifications of the insets; bottom, DAPI. (B) HeLa cells at various stages of the cell cycle were labeled with anti-hNup133 (green), CREST serum (red), and DAPI. Digital confocal micrographs of cells respectively in interphase (a), prophase (b), metaphase (c), early anaphase (d), late anaphase (e), and telophase (f) are presented. Bars, 5 μm.
Figure 9.
Figure 9.
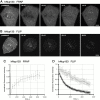
Turnover of GFP3-hNup133 on kinetochores. (A and B) GFP3-hNup133 binding to kinetochores was analyzed by FRAP (A) or FLIP (B) experiments in stable NRK cells. Bleach regions are outlined in the prebleach images. Note the incomplete recovery in FRAP after 8 min (A, 8:15) and the significant fluorescence remaining on kinetochores after cytoplasmic fluorescence was depleted to background in the FLIP (B, 5:13). (C) Plot of mean kinetochore recovery over time of FRAP experiments similar to A. Error bars are standard deviations (n = 10). (D) Plot of mean kinetochore (gray) and cytoplasmic (black) intensity over time with standard deviation (n = 5) of FLIP experiments similar to B. See also Fig. S3 and supplemental methods available at http://www.jcb.org/content/vol154/issue6. Bars, 5 μm.

Similar articles

Cited by

References

    1. Adam, S.A., R.S. Marr, and L. Gerace. 1990. Nuclear protein import in permeabilized mammalian cells requires soluble cytoplasmic factors. J. Cell Biol. 111:807–816. - PMC - PubMed
    1. Adams, R.R., M. Carmena, and W.C. Earnshaw. 2001. Chromosomal passengers and the (aurora) ABCs of mitosis. Trends Cell Biol. 11:49–54. - PubMed
    1. Azuma, Y., and M. Dasso. 2000. The role of Ran in nuclear function. Curr. Opin. Cell Biol. 12:302–330. - PubMed
    1. Belgareh, N., and V. Doye. 1999. Yeast and vertebrate nuclear-pore complexes: evolutionary conserved, yet divergent macromolecular assemblies. Protoplasma. 209:133–143.
    1. Bodoor, K., S. Shaikh, D. Salina, W.H. Raharjo, R. Bastos, M. Lohka, and B. Burke. 1999. Sequential recruitment of NPC proteins to the nuclear periphery at the end of mitosis. J. Cell Sci. 112:2253–2264. - PubMed

Publication types

MeSH terms

Substances