. 2001 Sep 15;535(Pt 3):767-81.
doi: 10.1111/j.1469-7793.2001.00767.x.

Interactions between NADPH oxidase-related proton and electron currents in human eosinophils

Affiliations

Interactions between NADPH oxidase-related proton and electron currents in human eosinophils

T E DeCoursey et al. J Physiol. .

Abstract

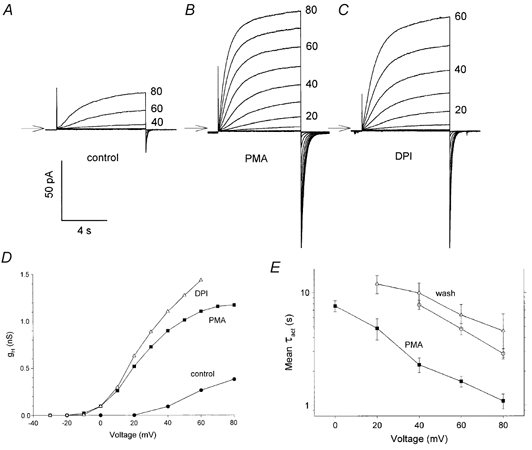
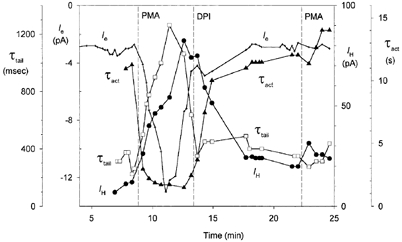
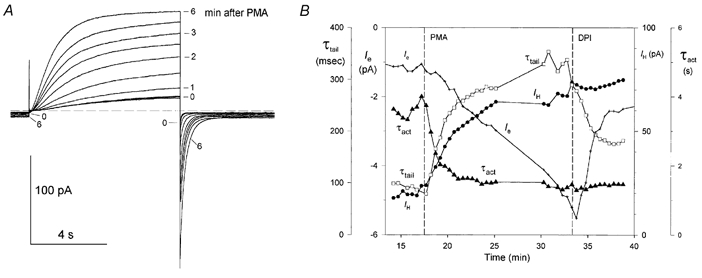
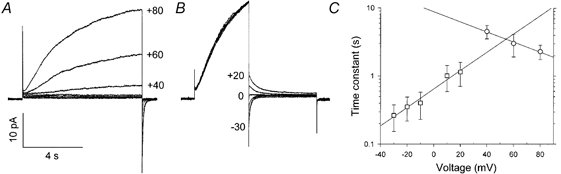
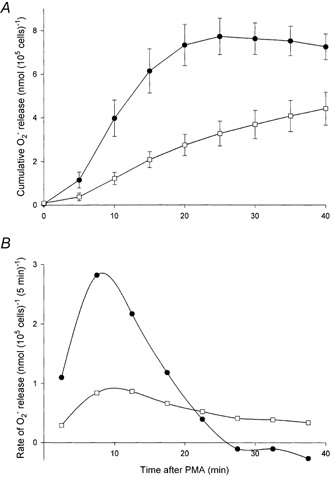
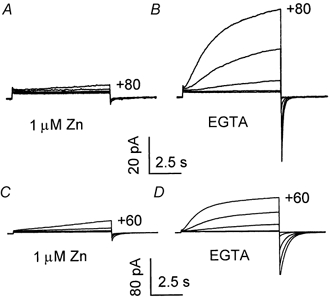
1. Proton and electron currents in human eosinophils were studied using the permeabilized-patch voltage-clamp technique, with an applied NH4+ gradient to control pH(i). 2. Voltage-gated proton channels in unstimulated human eosinophils studied with the permeabilized-patch approach had properties similar to those reported in whole-cell studies. 3. Superoxide anion (O2-) release assessed by cytochrome c reduction was compared in human eosinophils and neutrophils stimulated by phorbol myristate acetate (PMA). PMA-stimulated O2 release was more transient and the maximum rate was three times greater in eosinophils. 4. In PMA-activated eosinophils, the H+ current amplitude (I(H)) at +60 mV increased 4.7-fold, activation was 4.0 times faster, deactivation (tail current decay) was 5.4 times slower, the H+ conductance-voltage (g(H)-V) relationship was shifted -43 mV, and diphenylene iodinium (DPI)-inhibitable inward current reflecting electron flow through NADPH oxidase was activated. The data reveal that PMA activates the H+ efflux during the respiratory burst by modulating the properties of H+ channels, not simply as a result of NADPH oxidase activity. 5. The electrophysiological response of eosinophils to PMA resembled that reported in human neutrophils, but PMA activated larger proton and electron currents in eosinophils and the response was more transient. 6. ZnCl2 slowed the activation of H+ currents and shifted the g(H)-V relationship to more positive voltages. These effects occurred at similar ZnCl2 concentrations in eosinophils before and after PMA stimulation. These data are compatible with the existence of a single type of H+ channel in eosinophils that is modulated during the respiratory burst.


Figures

Figure 2
Figure 2. Effects of PMA and DPI on H+ current properties
A, currents recorded in an untreated eosinophil during depolarizing pulses from Vh= -60 mV to -40 mV through +80 mV in 20 mV increments are superimposed. B, currents in the same cell after addition of 30 nm PMA. Pulses were applied in 10 mV increments. C, currents in the same cell after addition of 3 μm DPI (and washout of PMA). The arrows indicate the level of zero current. D, chord conductance-voltage relationships in the same eosinophil as in A-C, before (•) and after PMA (▪), and after treatment with DPI (▵). Conductances were calculated from the net H+ current (defined as the time-dependent current) measured at the end of 8 s pulses like those in A, using Vrev measured in each solution (+4 mV control, -2.4 mV in PMA, and -4 mV in DPI). E, voltage dependence of τact in eosinophils before stimulation (○), after PMA activation (▪), and after washout and recovery (▵). Means ±s.e.m. are plotted for n = 13-14, 5-9, or 2-4 cells, respectively. In most cells DPI was added after PMA; only cells in which H+ current parameters returned to near normal (e.g. the cell in Fig. 5) are included in the ‘wash’ group.
Figure 5
Figure 5. An eosinophil exhibiting a transient response to PMA
Time course of electrophysiological changes produced by PMA in an eosinophil, with the same symbol definitions as in Fig. 4B. Ie (+) peaked ≈3 min after PMA addition and then spontaneously turned off almost completely. Intriguingly, the slowing of τtail (□) peaked and reversed with a time course that is a mirror-image of the time course of Ie. Although IH (•) and τact (▴) also reversed almost completely after addition of DPI, this was probably not a direct effect of DPI, because DPI did not affect these parameters in the experiment shown in Fig. 4B. The cell was refractory to a second exposure to PMA.
Figure 4
Figure 4. Time dependence of the electrophysiological effects of PMA on human eosinophils in the permeabilized-patch configuration
A, current records during test pulses to +60 mV from a holding potential of -60 mV are superimposed. The dashed line shows the zero current level. Two control currents (labeled ‘0′) were recorded before and after a bath change to control for possible flow artifacts. After application of 30 nm PMA test pulses were applied every 30 s; the first 7 are shown here. The first current recorded after PMA addition is superimposed on the control currents. IH increased noticeably 1 min after PMA addition and increased progressively over the next several minutes. The largest current illustrates a quasi-steady-state reached ≈6 min after PMA addition. The inward current at -60 mV (electron current) increased progressively after PMA addition, with the first and last record labelled according to the time after PMA addition (0 and 6 min). The tail currents increased in amplitude and became progressively slower. Low-pass filter 100 Hz. B, the changes in various parameters during exposure of another eosinophil to PMA and then DPI are plotted. The abscissae indicate roughly the time elapsed after establishing permeabilized patch recording. The dashed vertical lines indicate the time the bath solution was changed to introduce PMA or DPI, as indicated. H+ current parameters are IH (•), τtail (□), and τact (▴). The total holding current measured at -60 mV is labelled Ie (+) in the figure, because it gives information about the electron current - the actual net Ie is the additional inward current beyond baseline that was induced by PMA.
Figure 1
Figure 1. Properties of voltage-gated proton currents in unstimulated human eosinophils studied using the permeabilized patch technique
A, a family of currents during 8 s voltage pulses (at 30 s intervals) from -40 mV through +80 mV in 20 mV increments from Vh= -60 mV. B, tail currents measured in the same cell. A 4 s prepulse to +80 mV opened H+ channels, then the potential was stepped to -30 mV through +20 mV in 10 mV increments. Vrev is close to 0 mV, as expected for a symmetrical pH gradient (50 mm NH4+ in pipette and bath solutions, pH 7.0). Low-pass filtered at 100 Hz. C, mean ±s.d. time constants of activation, τact (○), and deactivation (tail current decay), τtail (□), are plotted (n = 10-12 cells), with lines showing linear regression slopes of 59 mV per e-fold change in voltage and 32 mV per e-fold change in voltage, respectively. The fitted lines show the following relationships: τact= 8.80exp(V/-58.7), and τtail= 0.646exp(V/32.2), where V is the voltage in millivolts and the time constants are in seconds.
Figure 3
Figure 3. Time course of PMA-stimulated O2 release from human eosinophils and human neutrophils
A, comparison of net cumulative O2 release from human eosinophils (•) and human neutrophils (□). Means ±s.e.m. are plotted for determinations of each cell type from the same four individuals. At time 0 the cells were stimulated with 8 nm PMA. B, rate of O2 release from human eosinophils (•) and human neutrophils (□). The data in A are replotted as the increment of O2 released in each 5 min interval. The points are positioned in the middle of their time bins, and the spline curve through the points is arbitrary.
Figure 6
Figure 6. The ZnCl2 sensitivity of H+ current is the same before and after activation with PMA
A, a family of currents in an unstimulated eosinophil in the presence of 1 μm ZnCl2 during pulses to 0 mV through +80 mV in 20 mV increments. In contrast with our usual bath solution, this solution had no EGTA. B, the same family of pulses applied after complete removal of ZnCl2 by washout with an EGTA-containing solution. The pulses families in A and B were started 16 and 18 min, respectively, after establishing permeabilized patch recording. The upper calibration bars apply to both A and B. C, approximately 21 min after starting the experiment, PMA was added, and the cell responded in the usual manner: H+ current activation was shifted to a more negative voltage range, τtail was characteristically slower, and -5 pA of Ie appeared. After 8 min 1 μm ZnCl2 was added and the family in C was recorded. The currents illustrated are for pulses to -20 mV through +60 mV in 20 mV increments. D, the same family of pulses applied after washout of the Zn2+. The families in C and D were started 29 and 32 min after starting the experiment. The lower calibration bars apply to C and D. The largest tail current in D was off-scale and was slightly truncated.
Figure 7
Figure 7. The depolarizing shift of voltage-dependent gating by ZnCl2 results in test-pulse dependence of apparent Zn2+ sensitivity
A, the dependence of the voltage shift of the gH-V relationship on ZnCl2 concentration is illustrated for a semi-empirical model of Zn2+ effects on voltage-gated proton channels (Cherny & DeCoursey, 1999). The numerical value of the shift was derived by assuming that the channel cannot open while Zn2+ is bound to it. The open probability of the channel in the absence of Zn2+ is given by a simple Boltzmann relationship: Popen= (1 + exp((V - V1/2)/k))−1 where the mid-point potential V1/2 was set arbitrarily at 0 mV and the slope factor k is -10 mV, a value typical for voltage-gated proton channels in many cells (DeCoursey & Cherny, 1994). By definition, if k = -10 mV then Popen is reduced e-fold in 10 mV. Hence, if Zn2+ reduced Popen e-fold this would shift the gH-V relationship by 10 mV (Cherny & DeCoursey, 1999). The curve is drawn according to: Vshift= ln(1 - PZn)−1× 10 mV, where Vshift is the voltage shift in mV, and PZn is the probability that the channel has Zn2+ bound. In turn, PZn is given by: PZn= (1 +[KM]/[Zn2+])−1 which assumes simple first-order binding with a binding constant KM= 10−7m. Whether or not the assumptions underlying the relationship in A are valid, the experimentally observed [Zn2+] dependence of the voltage shift is approximated well by this model (Cherny & DeCoursey, 1999). The inset illustrates the effect of a simple voltage shift. The upper diagram shows a right shift in the gH-V relationship produced by Zn2+ (dashed lines). The lower diagrams illustrate the appearance of currents measured at two voltages, V1 and V2, in the absence (continuous curves) or presence (dashed curves) of Zn2+. B, apparent concentration-response curves calculated on the assumption that the entire effect of Zn2+ can be described as a voltage shift. The relative current measured during a given voltage pulse will be reduced simply because Popen is reduced at each voltage when the gH-V relationship is shifted toward more positive voltages. The ratio plotted is of Popen after the voltage shift derived from A for each concentration of Zn2+ normalized to Popen in the absence of Zn2+. This corresponds with an idealized current ratio. Real current data would generally be complicated by the fact that the currents do not reach steady state with pulse durations normally employed, and the profound slowing effect of Zn2+ exacerbates this problem. The concentration-response relationships plotted here are somewhat steeper than a normal dose-response curve in which there is 1:1 binding of drug to a receptor.

Similar articles

Cited by

References

    1. Babior BM. NADPH oxidase: an update. Blood. 1999;93:1464–1476. - PubMed
    1. Bánfi B, Schrenzel J, Nüsse O, Lew DP, Ligeti E, Krause K-H, Demaurex N. A novel H+ conductance in eosinophils: unique characteristics and absence in chronic granulomatous disease. Journal of Experimental Medicine. 1999;190:183–194. - PMC - PubMed
    1. Bernheim L, Krause RM, Baroffio A, Hamann M, Kaelin A, Bader C-R. A voltage-dependent proton current in cultured human skeletal muscle myotubes. Journal of Physiology. 1993;470:313–333. - PMC - PubMed
    1. Cherny VV, DeCoursey AG, Henderson LM, Thomas LL, DeCoursey TE. Proton and electron currents during the respiratory burst in human eosinophils. Biophysical Journal. 2001a;80:506–507a. (abstract)
    1. Cherny VV, DeCoursey TE. pH dependent inhibition of voltage-gated H+ currents in rat alveolar epithelial cells by Zn2+ and other divalent cations. Journal of General Physiology. 1999;114:819–838. - PMC - PubMed

Publication types

LinkOut - more resources