

The murine beta-globin locus control region regulates the rate of transcription but not the hyperacetylation of histones at the active genes
- PMID: 11553791
- PMCID: PMC58747
- DOI: 10.1073/pnas.201394698
The murine beta-globin locus control region regulates the rate of transcription but not the hyperacetylation of histones at the active genes
Abstract
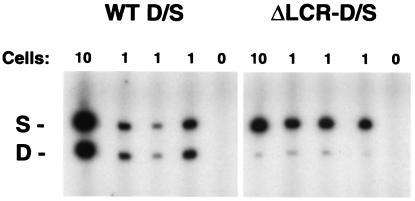
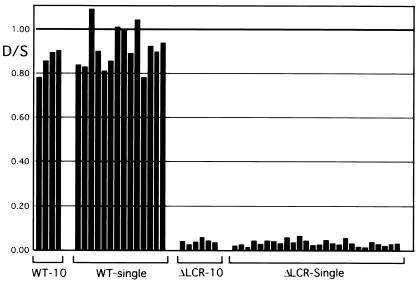
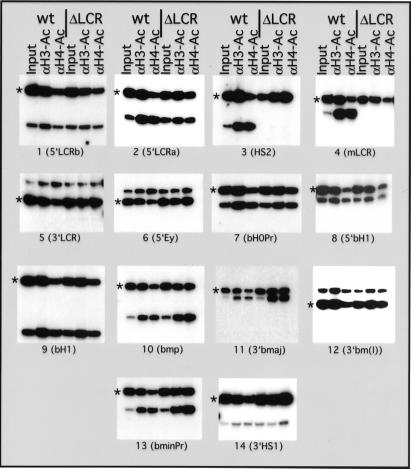
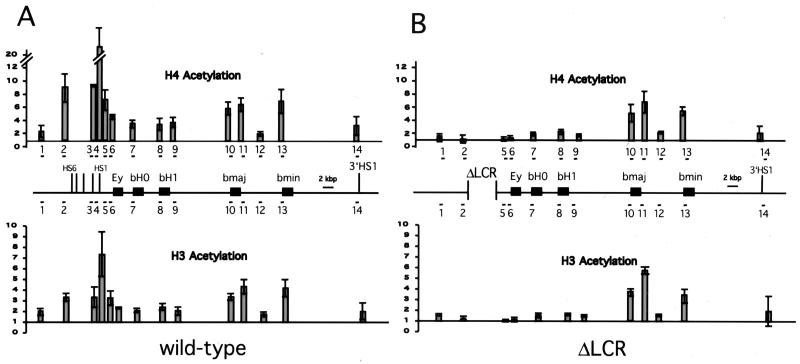
Locus control regions (LCRs) are defined by their ability to confer high-level tissue-specific expression to linked genes in transgenic assays. Previously, we reported that, at its native site, the murine beta-globin LCR is required for high-level beta-globin gene expression, but is not required to initiate an open chromatin conformation of the locus. To further investigate the mechanism of LCR-mediated transcriptional enhancement, we have analyzed allele-specific beta-globin expression and the pattern of histone acetylation in the presence and absence of the LCR. In single cells from mice heterozygous for a deletion of the LCR, beta-globin expression from the LCR-deleted allele is consistently low ( approximately 1-4% of wild type). Thus, the endogenous LCR enhances globin gene expression by increasing the rate of transcription from each linked allele rather than by increasing the probability of establishing transcription per se. Furthermore, in erythroid cells from mice homozygous for the highly expressing wild-type beta-globin locus, hyperacetylation of histones H3 and H4 is localized to the LCR and active genes. In mice homozygous for the LCR deletion reduced histone hyperacetylation is observed in LCR proximal sequences; however, deletion of the LCR has no effect on the localized hyperacetylation of the genes. Together, our results suggest that, in its native genomic context, the LCR follows the rate model of enhancer function, and that the developmentally specific hyperacetylation of the globin genes is independent of both the rate of transcription and the presence of the LCR.
Figures
Similar articles
-
Nuclear localization and histone acetylation: a pathway for chromatin opening and transcriptional activation of the human beta-globin locus.Genes Dev. 2000 Apr 15;14(8):940-50. Genes Dev. 2000. PMID: 10783166 Free PMC article.
-
The beta -globin locus control region (LCR) functions primarily by enhancing the transition from transcription initiation to elongation.Genes Dev. 2003 Apr 15;17(8):1009-18. doi: 10.1101/gad.1072303. Epub 2003 Apr 2. Genes Dev. 2003. PMID: 12672691 Free PMC article.
-
Activation of beta-major globin gene transcription is associated with recruitment of NF-E2 to the beta-globin LCR and gene promoter.Proc Natl Acad Sci U S A. 2001 Aug 28;98(18):10226-31. doi: 10.1073/pnas.181344198. Epub 2001 Aug 21. Proc Natl Acad Sci U S A. 2001. PMID: 11517325 Free PMC article.
-
Chromatin structure and transcriptional regulation of the beta-globin locus.Exp Cell Res. 2002 Aug 1;278(1):1-11. doi: 10.1006/excr.2002.5555. Exp Cell Res. 2002. PMID: 12126952 Review.
-
ChIPs of the beta-globin locus: unraveling gene regulation within an active domain.Curr Opin Genet Dev. 2002 Apr;12(2):170-7. doi: 10.1016/s0959-437x(02)00283-6. Curr Opin Genet Dev. 2002. PMID: 11893490 Review.
Cited by
-
Distinct chromatin configurations regulate the initiation and the maintenance of hGH gene expression.Mol Cell Biol. 2013 May;33(9):1723-34. doi: 10.1128/MCB.01166-12. Epub 2013 Feb 19. Mol Cell Biol. 2013. PMID: 23428872 Free PMC article.
-
Intergenic transcription, cell-cycle and the developmentally regulated epigenetic profile of the human beta-globin locus.PLoS One. 2007 Jul 18;2(7):e630. doi: 10.1371/journal.pone.0000630. PLoS One. 2007. PMID: 17637845 Free PMC article.
-
Activation of the chicken Ig-beta locus by the collaboration of scattered regulatory regions through changes in chromatin structure.Nucleic Acids Res. 2006 Aug 11;34(13):3794-802. doi: 10.1093/nar/gkl469. Print 2006. Nucleic Acids Res. 2006. PMID: 16916790 Free PMC article.
-
A complex chromatin landscape revealed by patterns of nuclease sensitivity and histone modification within the mouse beta-globin locus.Mol Cell Biol. 2003 Aug;23(15):5234-44. doi: 10.1128/MCB.23.15.5234-5244.2003. Mol Cell Biol. 2003. PMID: 12861010 Free PMC article.
-
The principles of nuclear structure.Chromosome Res. 2003;11(5):387-401. doi: 10.1023/a:1024954123092. Chromosome Res. 2003. PMID: 12971716 Review.
References
-
- Bulger M, Groudine M. Genes Dev. 1999;13:2465–2477. - PubMed
-
- Engel J D, Tanimoto K. Cell. 2000;100:499–502. - PubMed
-
- Higgs D R. Cell. 1998;95:299–302. - PubMed
-
- Epner E, Reik A, Cimbora D, Telling A, Bender M A, Fiering S, Enver T, Martin D I, Kennedy M, Keller G, Groudine M. Mol Cell. 1998;2:447–455. - PubMed
Publication types
MeSH terms
Substances
Grants and funding
LinkOut - more resources
Full Text Sources
