

Comparative Study
doi: 10.1128/AEM.67.9.4374-4376.2001.
Quantitative comparisons of 16S rRNA gene sequence libraries from environmental samples
Affiliations
- PMID: 11526051
- PMCID: PMC93175
- DOI: 10.1128/AEM.67.9.4374-4376.2001
Item in Clipboard
Comparative Study
Quantitative comparisons of 16S rRNA gene sequence libraries from environmental samples
Appl Environ Microbiol.
2001 Sep.
Abstract
To determine the significance of differences between clonal libraries of environmental rRNA gene sequences, differences between homologous coverage curves, CX(D), and heterologous coverage curves, CXY(D), were calculated by a Cramér-von Mises-type statistic and compared by a Monte Carlo test procedure. This method successfully distinguished rRNA gene sequence libraries from soil and bioreactors and correctly failed to find differences between libraries of the same composition.
Figures
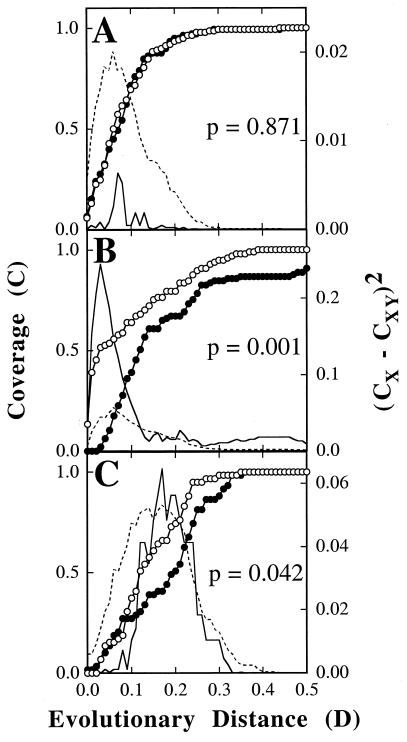
Results of selected LIBSHUFF comparisons. Homologous (○) and heterologous (●) coverage curves for 16S rRNA gene sequence libraries from environmental samples are shown. Solid lines indicate the value of (CX − CXY)2 for the original samples at each value of D. D is equal the Jukes-Cantor evolutionary distance determined by the DNADIST program of PHYLIP (3). Broken lines indicate the 950th value (or P = 0.05) of (CX − CXY)2 for the randomized samples. (A) Comparison of clones from grassland soils with odd (X) and even (Y) accession numbers. (B) Comparison of bioreactor clones SBR1 (X) and grassland soil SL clones (Y). (C) Comparison of C0 (X) and S0 (Y) clones from arid soils.
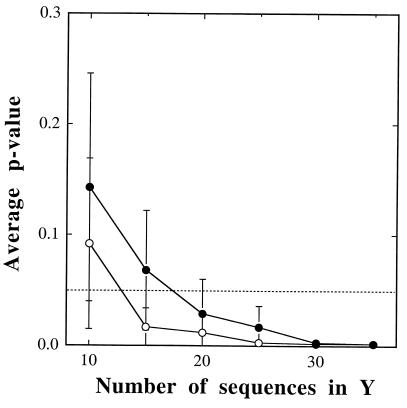
Effect of sample size on the discrimination of libraries. A comparison of the SL library from grassland soil (Y; n = variable) to the bioreactor library SBR1 (X; n = 97) (●) and a comparison of the SBR1 (Y; n = variable) library to the SL (X; n = 137) library (○) shown. Each point represents an average of 10 replicates, and the error bars are 1 standard deviation. The broken line indicates P = 0.05.
Similar articles
-
Identifying the dominant soil bacterial taxa in libraries of 16S rRNA and 16S rRNA genes.Appl Environ Microbiol. 2006 Mar;72(3):1719-28. doi: 10.1128/AEM.72.3.1719-1728.2006. Appl Environ Microbiol. 2006. PMID: 16517615 Free PMC article. Review. No abstract available.
-
Levels of bacterial community diversity in four arid soils compared by cultivation and 16S rRNA gene cloning.Appl Environ Microbiol. 1999 Apr;65(4):1662-9. doi: 10.1128/AEM.65.4.1662-1669.1999. Appl Environ Microbiol. 1999. PMID: 10103265 Free PMC article.
-
Phylogenetic diversity of Acidobacteria in a former agricultural soil.ISME J. 2009 Mar;3(3):378-82. doi: 10.1038/ismej.2008.113. Epub 2008 Nov 20. ISME J. 2009. PMID: 19020558
-
Integration of microbial ecology and statistics: a test to compare gene libraries.Appl Environ Microbiol. 2004 Sep;70(9):5485-92. doi: 10.1128/AEM.70.9.5485-5492.2004. Appl Environ Microbiol. 2004. PMID: 15345436 Free PMC article.
-
Members of the phylum Acidobacteria are dominant and metabolically active in rhizosphere soil.FEMS Microbiol Lett. 2008 Aug;285(2):263-9. doi: 10.1111/j.1574-6968.2008.01232.x. Epub 2008 Jun 28. FEMS Microbiol Lett. 2008. PMID: 18557943
Cited by
-
Molecular analysis of the bacterial communities in crude oil samples from two brazilian offshore petroleum platforms.Int J Microbiol. 2012;2012:156537. doi: 10.1155/2012/156537. Epub 2012 Jan 29. Int J Microbiol. 2012. PMID: 22319534 Free PMC article.
-
Actinobacterial community structure in soils receiving long-term organic and inorganic amendments.Appl Environ Microbiol. 2008 Jan;74(2):526-30. doi: 10.1128/AEM.00843-07. Epub 2007 Oct 12. Appl Environ Microbiol. 2008. PMID: 17933943 Free PMC article.
-
Fecal microbiota transplantation with frozen capsules for a patient with refractory acute gut graft-versus-host disease.Blood Adv. 2018 Nov 27;2(22):3097-3101. doi: 10.1182/bloodadvances.2018024968. Blood Adv. 2018. PMID: 30446486 Free PMC article.
-
Microbial community response to a simulated hydrocarbon spill in mangrove sediments.J Microbiol. 2010 Feb;48(1):7-15. doi: 10.1007/s12275-009-0147-1. Epub 2010 Mar 11. J Microbiol. 2010. PMID: 20221723
-
Influence of soil characteristics on the diversity of bacteria in the Southern Brazilian Atlantic Forest.Appl Environ Microbiol. 2010 Jul;76(14):4744-9. doi: 10.1128/AEM.03025-09. Epub 2010 May 21. Appl Environ Microbiol. 2010. PMID: 20495051 Free PMC article.
References
-
- Felsenstein J. PHYLIP (phylogenetic inference package) version 3.5c. Seattle: University of Washington; 1993.
-
- Good I J. The population frequencies of species and the estimation of population parameters. Biometrika. 1953;40:237–264.
-
- Hope A C A. A simplified Monte Carlo significance test procedure. J Royal Statist Soc B. 1968;30:582–598.
Publication types
MeSH terms
Substances
LinkOut - more resources
Full Text Sources
Other Literature Sources
