. 2001 Aug 6;154(3):499-509.
doi: 10.1083/jcb.200105084.

RNA-mediated interaction of Cajal bodies and U2 snRNA genes

Affiliations

RNA-mediated interaction of Cajal bodies and U2 snRNA genes

M R Frey et al. J Cell Biol. .

Abstract

Cajal bodies (CBs) are nuclear structures involved in RNA metabolism that accumulate high concentrations of small nuclear ribonucleoproteins (snRNPs). Notably, CBs preferentially associate with specific genomic loci in interphase human cells, including several snRNA and histone gene clusters. To uncover functional elements involved in the interaction of genes and CBs, we analyzed the expression and subcellular localization of stably transfected artificial arrays of U2 snRNA genes. Although promoter substitution arrays colocalized with CBs, constructs containing intragenic deletions did not. Additional experiments identified factors within CBs that are important for association with the native U2 genes. Inhibition of nuclear export or targeted degradation of U2 snRNPs caused a marked decrease in the levels of U2 snRNA in CBs and strongly disrupted the interaction with U2 genes. Together, the results illustrate a specific requirement for both the snRNA transcripts as well as the presence of snRNPs (or snRNP proteins) within CBs. Our data thus provide significant insight into the mechanism of CB interaction with snRNA loci, strengthening the putative role for this nuclear suborganelle in snRNP biogenesis.


Figures

Figure 1.
Figure 1.
Constructs used to create artificial tandem arrays. The top three constructs were described previously (Frey et al. 1999); the bottom three were used in this study. DSE and PSE (circles) are distal and PSEs, respectively. Deletions are denoted by parentheses. Arrowheads mark coding regions; the filled ones represent the U2 coding region, whereas the open arrowheads depict the replacement sequence. The 3′ box is an element required for proper 3′ end processing of snRNAs. CT is a microsatellite repeat. The RSV-U2 construct incorporates an RSV promoter upstream of the U2 coding region and a bovine growth hormone polyadenylation signal (BGH poly A) downstream of the CT element. Primers used for RT-PCR are indicated by arrows. The dashed line denotes the location of a cryptic intron (see text). Results of transcription (Txn) and CB association (CB Assoc.) experiments for stable arrays of the corresponding constructs are also shown.
Figure 2.
Figure 2.
(A) The sequence and secondary structure of the human U2 snRNA is shown. The boxed element marks the Sm protein binding site. Arrows indicate boundaries of deletion constructs for stem loop I (6–26) and IV (145–187). (B) Arrays of Replacement+CT and U2ΔStemIV constructs do not associate with CBs. Two Replacement+CT cell lines (AdCT1A5 and AdCT1C1) and three U2ΔstemIV lines (S41D1, S42D1, and S42D2) were scored as described previously (Frey et al., 1999). The CB association frequencies were calculated by dividing the number of exogenous U2 loci colocalized with a CB by the total number of associated U2 loci. Gene copy number and average number of CBs/cell are also shown.
Figure 3.
Figure 3.
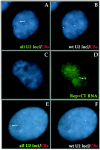
FISH and IF of artificial U2 arrays. (A and B) Replacement+CT arrays do not associate with CBs. Endogenous RNU2 loci (B) are shown in white; all U2 loci (A) are shown in green. CBs are shown in red. DAPI-stained nuclei are shown in blue. As seen in A, Replacement+CT arrays never colocalized with CBs (arrow). (C and D) Replacement+CT arrays are transcribed, as demonstrated by the RNA–FISH signal (D). The same nucleus stained with DAPI is shown in C. (E and F) Deletion of sequences encoding stem loop IV of U2 snRNA also disrupts association with CBs. DNA FISH/IF images show that CBs do not interact with U2ΔstemIV arrays (E, arrow), whereas association with wild-type RNU2 loci is unaffected (F).
Figure 4.
Figure 4.
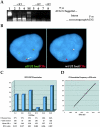
RSV-driven U2 genes interact with CBs. (A) RT-PCR was performed on total RNA isolated from RSV-U2 cell lines using an oligo-dT primer for first-strand synthesis in the presence (+RT) or absence (−RT) of reverse transcriptase. Subsequently, PCR products with primers shown in Fig. 1 were separated on an agarose gel. (Lane 1) Positive control template, pRSV-U2 DNA. (Lanes 2–4) RNA from cell lines R51B6, R1A2, and R51C6. M, marker. (Lanes 5–7) R51B6, R1A2, and R51C6. (Lane 8) Negative control cell line (iU2A37) with an artificial array of wild-type U2 genes (Frey et al., 1999). Sequencing revealed the presence of an intron within the RSV-U2 RNA. The sequence around the intron junction is shown at right. (B) DNA FISH and IF demonstrate colocalization of CBs with RSV-U2 genes. Arrow marks the RSV-U2 locus. The probes used are denoted by color-coded text at bottom of each panel. (C and D) Data collected from RSV-U2 cell lines. The y axis of each graph represents CB association frequency. The graph on the left (C) shows results of scoring experiments and characterization of RSV-U2 cell lines. On the right (D) is a graph of CB association frequency versus RNA ratio, revealing a linear correlation. The RNA ratio represents the steady-state level of exogneous U2 RNA divided by the endogenous amount.
Figure 5.
Figure 5.
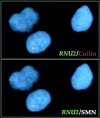
SMN gems, which lack snRNPs, do not colocalize with RNU2 loci. For better separation of gems and CBs, HeLa-PV cells were grown at 32°C before fixation and staining with anticoilin (top, red) and anti-SMN (bottom, white) antibodies. Subsequently, DNA FISH was performed with an RNU2 probe to detect U2 genes (green signals, both panels). Of the ∼100 cells examined, RNU2 loci were never observed to overlap with non-snRNP–containing SMN gems. Arrows mark a RNU2–CB association (top) that does not colocalize with a gem (bottom).
Figure 6.
Figure 6.
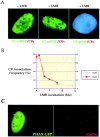
Inhibition of snRNA export disrupts RNU2–CB association. (A) HeLa cells were incubated in the presence or absence of LMB for 3 h and then stained with anti-U2B″ (green) and anticoilin antibodies (red). At early time points (3–5 h) CBs remain prominent; although, diffuse accumulation of coilin within nucleoli is also observed (Carvalho et al., 1999). The presence of U2 snRNPs in CBs on the left is demonstrated by the yellow color. The lack of signal overlap is evident in the middle (note red color). On the right, FISH reveals that CBs (red) and U2 genes (green) do not colocalize. (B) CB association with U2 genes decreases with increasing incubation time in LMB. (C) HeLa cells were transfected with PHAX–GFP and costained with anticoilin. In addition to localization throughout the nucleoplasm, note accumulation of PHAX–GFP (green) within the CBs (red) of the transfected cell.
Figure 7.
Figure 7.
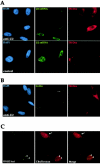
RNaseH-mediated degradation of U2 snRNPs inhibits interaction of CBs and U2 genes. (A) HeLa cells were microinjected in the cytoplasm with anti-U2 (top) or control (bottom) deoxyoligonucleotides, along with a Texas red–conjugated dextran. The dextran cannot diffuse through the nuclear pores and thus marks the injected cells. Note loss of the overall speckled pattern, including CB staining, in cells injected with anti-U2 oligomers, but not in cells injected with control oligos (arrow). (B) Injection of anti-U2 oligos had no effect on coilin staining. Prominent CBs are visible in injected cells (arrow), even when mistakenly injected in the nucleus (arrowhead). (C) Injected cells were processed for FISH/IF and then visually screened for those that retained significant Texas red signal in the cytoplasm to mark injected cells (arrow). Note lack of overlap between CBs (red dots in nucleoplasm) and FISH signals (green) in the injected cells. Arrowheads mark CBs that overlap with U2 genes in uninjected cells. (D) Using a dual-pass filter set, cells were scored for association of CBs with RNU2 or RNU1 loci in cells injected with either anti-U2 or control oligos (For columns 1–5, the number of cells scored was 100, 80, 80, 70, and 70, respectively). The CB association frequency represents the percentage of nuclei that had at least one overlapping pair of signals. Cells injected with control oligos had similar RNU2–CB association frequencies to those of uninjected cells. Injection of anti-U2 oligomers significantly inhibited the interaction of CBs with RNU2, but not with RNU1 loci.
Figure 7.
Figure 7.
RNaseH-mediated degradation of U2 snRNPs inhibits interaction of CBs and U2 genes. (A) HeLa cells were microinjected in the cytoplasm with anti-U2 (top) or control (bottom) deoxyoligonucleotides, along with a Texas red–conjugated dextran. The dextran cannot diffuse through the nuclear pores and thus marks the injected cells. Note loss of the overall speckled pattern, including CB staining, in cells injected with anti-U2 oligomers, but not in cells injected with control oligos (arrow). (B) Injection of anti-U2 oligos had no effect on coilin staining. Prominent CBs are visible in injected cells (arrow), even when mistakenly injected in the nucleus (arrowhead). (C) Injected cells were processed for FISH/IF and then visually screened for those that retained significant Texas red signal in the cytoplasm to mark injected cells (arrow). Note lack of overlap between CBs (red dots in nucleoplasm) and FISH signals (green) in the injected cells. Arrowheads mark CBs that overlap with U2 genes in uninjected cells. (D) Using a dual-pass filter set, cells were scored for association of CBs with RNU2 or RNU1 loci in cells injected with either anti-U2 or control oligos (For columns 1–5, the number of cells scored was 100, 80, 80, 70, and 70, respectively). The CB association frequency represents the percentage of nuclei that had at least one overlapping pair of signals. Cells injected with control oligos had similar RNU2–CB association frequencies to those of uninjected cells. Injection of anti-U2 oligomers significantly inhibited the interaction of CBs with RNU2, but not with RNU1 loci.

Similar articles

Cited by

References

    1. Andrade, L.E.C., E.M. Tan, and E.K.L. Chan. 1993. Immunocytochemical analysis of the coiled body in the cell cycle and during cell proliferation. Proc. Natl. Acad. Sci. USA. 90:1947–1951. - PMC - PubMed
    1. Bailey, A., Z. Li, T. Pavelitz, and A. Weiner. 1995. Adenovirus type 12-induced fragility of the human RNU2 locus requires U2 small nuclear RNA transcriptional regulatory elements. Mol. Cell. Biol. 15:6246–6255. - PMC - PubMed
    1. Carmo-Fonseca, M., R. Pepperkok, M.T. Carvalho, and A.I. Lamond. 1992. Transcription-dependent colocalization of the U1, U2, U4/U6 and U5 snRNPs in coiled bodies. J. Cell Biol. 117:1–14. - PMC - PubMed
    1. Carmo-Fonseca, M., J. Ferreira, and A.I. Lamond. 1993. Assembly of snRNP-containing coiled bodies is regulated in interphase and mitosis—evidence that the coiled body is a kinetic nuclear structure. J. Cell Biol. 120:841–852. - PMC - PubMed
    1. Carvalho, T., F. Almeida, A. Calapez, M. Lafarga, M.T. Berciano, and M. Carmo-Fonseca. 1999. The spinal muscular atrophy disease gene product, SMN: a link between snRNP biogenesis and the Cajal (coiled) body. J. Cell Biol. 147:715–728. - PMC - PubMed

Publication types

MeSH terms