

Human immunodeficiency virus type 1 DNA sequences genetically damaged by hypermutation are often abundant in patient peripheral blood mononuclear cells and may be generated during near-simultaneous infection and activation of CD4(+) T cells
- PMID: 11483742
- PMCID: PMC115041
- DOI: 10.1128/jvi.75.17.7973-7986.2001
Human immunodeficiency virus type 1 DNA sequences genetically damaged by hypermutation are often abundant in patient peripheral blood mononuclear cells and may be generated during near-simultaneous infection and activation of CD4(+) T cells
Abstract
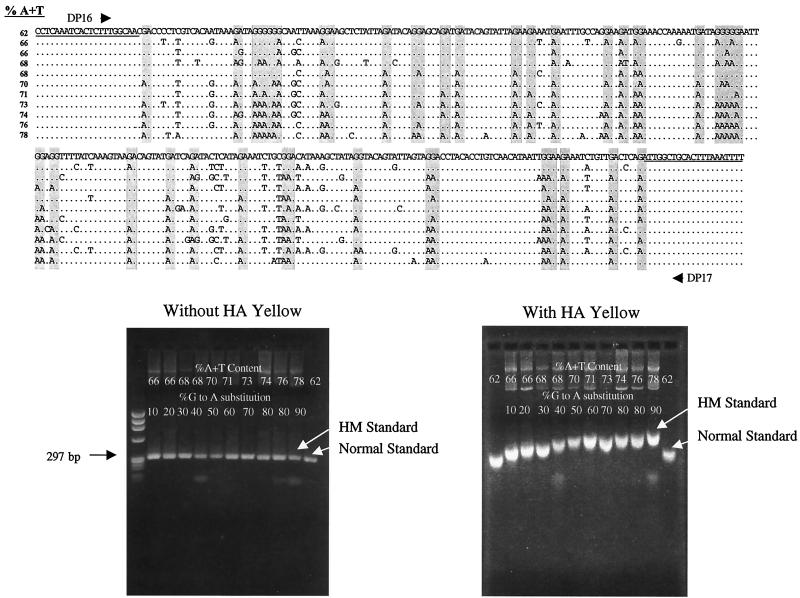
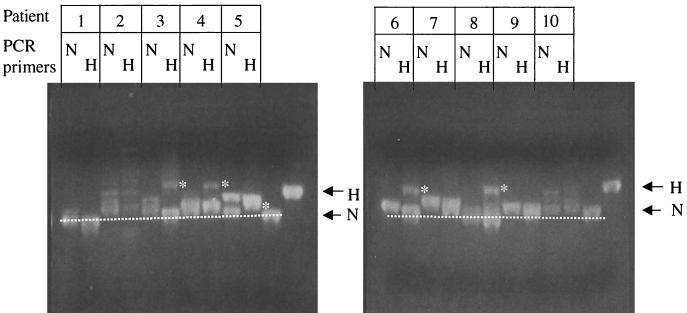
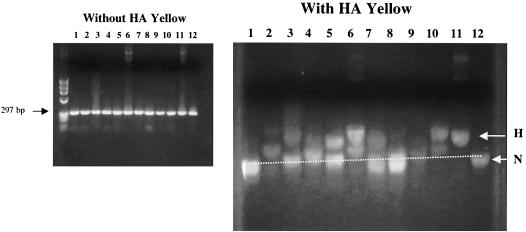
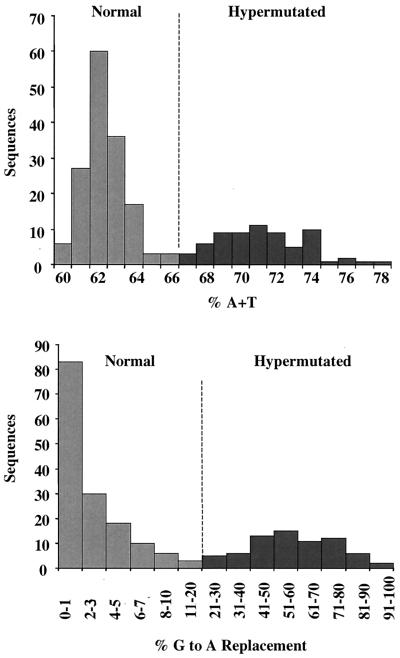
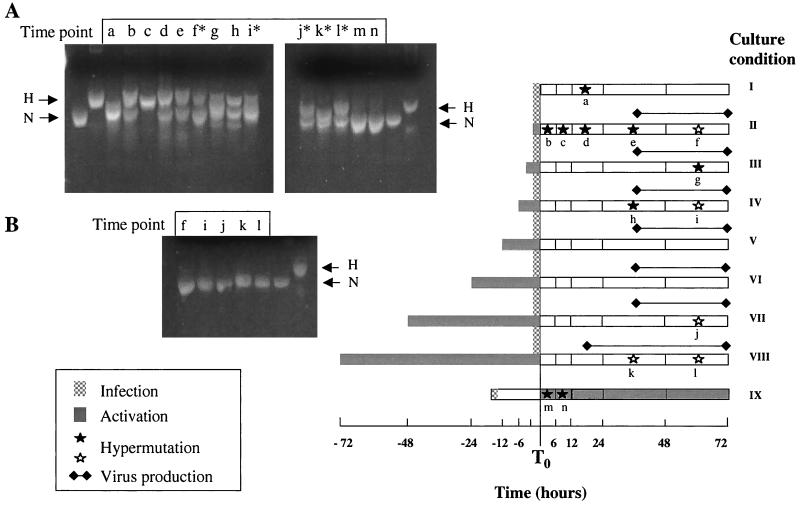
G-to-A hypermutation has been sporadically observed in human immunodeficiency virus type 1 (HIV-1) proviral sequences from patient peripheral blood mononuclear cells (PBMC) and virus cultures but has not been systematically evaluated. PCR primers matched to normal and hypermutated sequences were used in conjunction with an agarose gel electrophoresis system incorporating an AT-binding dye to visualize, separate, clone, and sequence hypermutated and normal sequences in the 297-bp HIV-1 protease gene amplified from patient PBMC. Among 53 patients, including individuals infected with subtypes A through D and at different clinical stages, at least 43% of patients harbored abundant hypermutated, along with normal, protease genes. In 70 hypermutated sequences, saturation of G residues in the GA or GG dinucleotide context ranged from 20 to 94%. Levels of other mutants were not elevated, and G-to-A replacement was entirely restricted to GA or GG, and not GC or GT, dinucleotides. Sixty-nine of 70 hypermutated and 3 of 149 normal sequences had in-frame stop codons. To investigate the conditions under which hypermutation occurs in cell cultures, purified CD4(+) T cells from normal donors were infected with cloned NL4-3 virus stocks at various times before and after phytohemagglutinin (PHA) activation. Hypermutation was pronounced when HIV-1 infection occurred simultaneously with, or a few hours after, PHA activation, but after 12 h or more after PHA activation, most HIV-1 sequences were normal. Hypermutated sequences generated in culture corresponded exactly in all parameters to those obtained from patient PBMC. Near-simultaneous activation and infection of CD4(+) T cells may represent a window of susceptibility where the informational content of HIV-1 sequences is lost due to hypermutation.
Figures


Similar articles
-
G-->A hypermutation in protease and reverse transcriptase regions of human immunodeficiency virus type 1 residing in resting CD4+ T cells in vivo.J Virol. 2005 Feb;79(3):1975-80. doi: 10.1128/JVI.79.3.1975-1980.2005. J Virol. 2005. PMID: 15650227 Free PMC article.
-
Analysis of the percentage of human immunodeficiency virus type 1 sequences that are hypermutated and markers of disease progression in a longitudinal cohort, including one individual with a partially defective Vif.J Virol. 2009 Aug;83(16):7805-14. doi: 10.1128/JVI.00280-09. Epub 2009 Jun 3. J Virol. 2009. PMID: 19494014 Free PMC article.
-
High rates of human immunodeficiency virus type 1 mutational profiles by single-genome amplification after 48-hour propagation in peripheral blood mononuclear cells at different levels of cell activation.Intervirology. 2014;57(5):277-88. doi: 10.1159/000362415. Epub 2014 Jun 28. Intervirology. 2014. PMID: 24994530
-
Human immunodeficiency virus (HIV) type 1 proviral hypermutation correlates with CD4 count in HIV-infected women from Kenya.J Virol. 2008 Aug;82(16):8172-82. doi: 10.1128/JVI.01115-08. Epub 2008 Jun 11. J Virol. 2008. PMID: 18550667 Free PMC article.
-
Hypermutation of HIV type 1 genomes isolated from infants soon after vertical infection.AIDS Res Hum Retroviruses. 2003 Dec;19(12):1115-23. doi: 10.1089/088922203771881211. AIDS Res Hum Retroviruses. 2003. PMID: 14709248
Cited by
-
APOBECs and virus restriction.Virology. 2015 May;479-480:131-45. doi: 10.1016/j.virol.2015.03.012. Epub 2015 Mar 26. Virology. 2015. PMID: 25818029 Free PMC article. Review.
-
APOBEC3 inhibition of mouse mammary tumor virus infection: the role of cytidine deamination versus inhibition of reverse transcription.J Virol. 2013 May;87(9):4808-17. doi: 10.1128/JVI.00112-13. Epub 2013 Feb 28. J Virol. 2013. PMID: 23449789 Free PMC article.
-
APOBECs and Herpesviruses.Viruses. 2021 Feb 28;13(3):390. doi: 10.3390/v13030390. Viruses. 2021. PMID: 33671095 Free PMC article. Review.
-
No evidence of xenotropic murine leukemia virus-related virus transmission by blood transfusion from infected rhesus macaques.J Virol. 2013 Feb;87(4):2278-86. doi: 10.1128/JVI.02326-12. Epub 2012 Dec 12. J Virol. 2013. PMID: 23236064 Free PMC article.
-
Epstein-Barr virus BORF2 inhibits cellular APOBEC3B to preserve viral genome integrity.Nat Microbiol. 2019 Jan;4(1):78-88. doi: 10.1038/s41564-018-0284-6. Epub 2018 Nov 12. Nat Microbiol. 2019. PMID: 30420783 Free PMC article.
References
-
- Bebenek K, Abbotts J, Roberts J D, Wilson S H, Kunkel T A. Specificity and mechanism of error-prone replication by human immunodeficiency virus-1 reverse transcriptase. J Biol Chem. 1989;264:16948–16956. - PubMed
-
- Bianchi V, Borella S, Rampazzo C, Ferraro P, Calderazzo F, Bianchi L C, Skog S, Reichard P. Cell cycle-dependent metabolism of pyrimidine deoxynucleoside triphosphates in CEM cells. J Biol Chem. 1997;272:16118–16124. - PubMed
-
- Borman A M, Quillent C, Charneau P, Kean K M, Clavel F. A highly defective HIV-1 group O provirus: evidence for the role of local sequence determinants in G→A hypermutation during negative-strand viral DNA synthesis. Virology. 1995;208:601–609. - PubMed
-
- Bray G, Brent T P. Deoxyribonucleoside 5′-triphosphate pool fluctuations during the mammalian cell cycle. Biochim Biophys Acta. 1972;269:184–191. - PubMed
Publication types
MeSH terms
Substances
LinkOut - more resources
Full Text Sources
Other Literature Sources
Medical
Molecular Biology Databases
Research Materials
Miscellaneous
