

Repressing a repressor: gibberellin-induced rapid reduction of the RGA protein in Arabidopsis
- PMID: 11449051
- PMCID: PMC139546
- DOI: 10.1105/tpc.010047
Repressing a repressor: gibberellin-induced rapid reduction of the RGA protein in Arabidopsis
Abstract
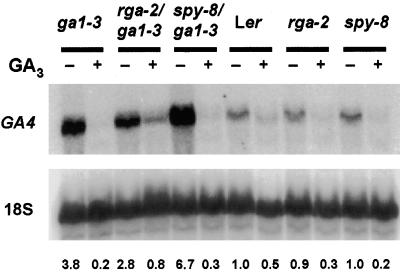
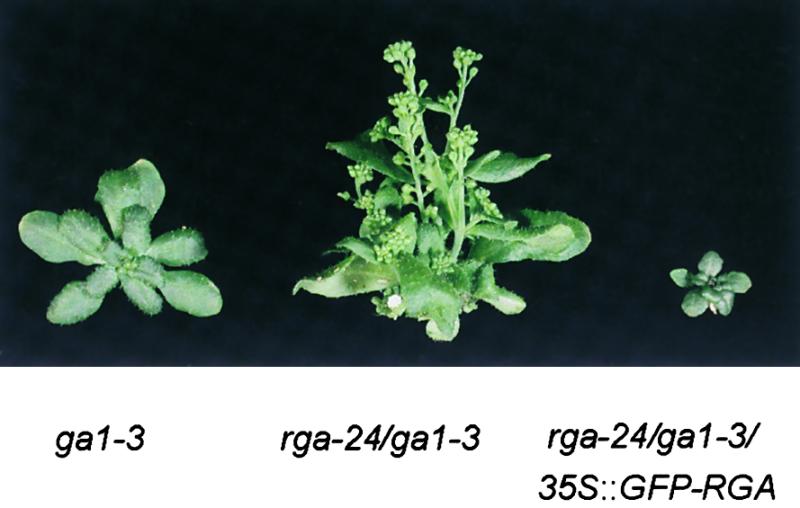
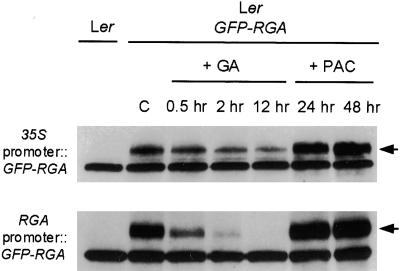
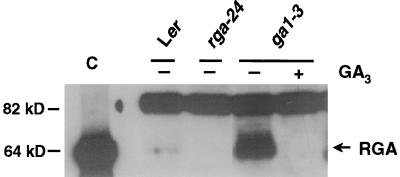
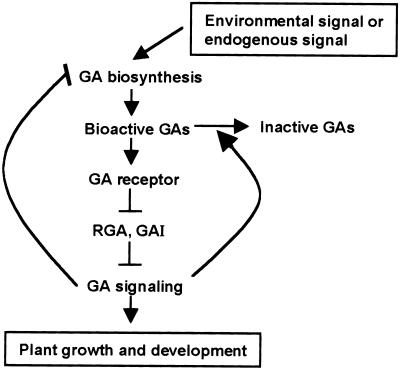
RGA (for repressor of ga1-3) and SPINDLY (SPY) are likely repressors of gibberellin (GA) signaling in Arabidopsis because the recessive rga and spy mutations partially suppressed the phenotype of the GA-deficient mutant ga1-3. We found that neither rga nor spy altered the GA levels in the wild-type or the ga1-3 background. However, expression of the GA biosynthetic gene GA4 was reduced 26% by the rga mutation, suggesting that partial derepression of the GA response pathway by rga resulted in the feedback inhibition of GA4 expression. The green fluorescent protein (GFP)-RGA fusion protein was localized to nuclei in transgenic Arabidopsis. This result supports the predicted function of RGA as a transcriptional regulator based on sequence analysis. Confocal microscopy and immunoblot analyses demonstrated that the levels of both the GFP-RGA fusion protein and endogenous RGA were reduced rapidly by GA treatment. Therefore, the GA signal appears to derepress the GA signaling pathway by degrading the repressor protein RGA. The effect of rga on GA4 gene expression and the effect of GA on RGA protein level allow us to identify part of the mechanism by which GA homeostasis is achieved.
Figures


Similar articles
-
The DELLA motif is essential for gibberellin-induced degradation of RGA.Proc Natl Acad Sci U S A. 2001 Nov 20;98(24):14162-7. doi: 10.1073/pnas.251534098. Proc Natl Acad Sci U S A. 2001. PMID: 11717468 Free PMC article.
-
The Arabidopsis RGA gene encodes a transcriptional regulator repressing the gibberellin signal transduction pathway.Plant Cell. 1998 Feb;10(2):155-69. doi: 10.1105/tpc.10.2.155. Plant Cell. 1998. PMID: 9490740 Free PMC article.
-
Arabidopsis RGL1 encodes a negative regulator of gibberellin responses.Plant Cell. 2002 Jan;14(1):87-100. doi: 10.1105/tpc.010325. Plant Cell. 2002. PMID: 11826301 Free PMC article.
-
Gibberellin receptor and its role in gibberellin signaling in plants.Annu Rev Plant Biol. 2007;58:183-98. doi: 10.1146/annurev.arplant.58.032806.103830. Annu Rev Plant Biol. 2007. PMID: 17472566 Review.
-
Dissecting the gibberellin response pathway.Curr Biol. 1998 Feb 26;8(5):R165-7. doi: 10.1016/s0960-9822(98)70101-0. Curr Biol. 1998. PMID: 9501058 Review.
Cited by
-
Asymmetric gibberellin signaling regulates vacuolar trafficking of PIN auxin transporters during root gravitropism.Proc Natl Acad Sci U S A. 2013 Feb 26;110(9):3627-32. doi: 10.1073/pnas.1300107110. Epub 2013 Feb 7. Proc Natl Acad Sci U S A. 2013. PMID: 23391733 Free PMC article.
-
A novel dwarfing mutation in a green revolution gene from Brassica rapa.Plant Physiol. 2005 Mar;137(3):931-8. doi: 10.1104/pp.104.057646. Epub 2005 Feb 25. Plant Physiol. 2005. PMID: 15734906 Free PMC article.
-
GRAS-domain transcription factors that regulate plant development.Plant Signal Behav. 2009 Aug;4(8):698-700. doi: 10.4161/psb.4.8.9176. Epub 2009 Aug 4. Plant Signal Behav. 2009. PMID: 19820314 Free PMC article. Review.
-
The gar2 and rga alleles increase the growth of gibberellin-deficient pollen tubes in Arabidopsis.Plant Physiol. 2004 Feb;134(2):694-705. doi: 10.1104/pp.103.031666. Epub 2004 Feb 5. Plant Physiol. 2004. PMID: 14764903 Free PMC article.
-
The DELLA motif is essential for gibberellin-induced degradation of RGA.Proc Natl Acad Sci U S A. 2001 Nov 20;98(24):14162-7. doi: 10.1073/pnas.251534098. Proc Natl Acad Sci U S A. 2001. PMID: 11717468 Free PMC article.
References
-
- Ausubel, F.M., Brent, R., Kingston, R.E., Moore, D.D., Seidman, J.G., Smith, J.A., and Struhl, K., eds (1990). Current Protocols in Molecular Biology. (New York: Green Publishing Associates/Wiley-Interscience).
-
- Bechtold, N., Ellis, J., and Pelletier, G. (1993). In planta Agrobacterium mediated gene transfer by infiltration of adult Arabidopsis thaliana plants. C. R. Acad. Sci. Paris Life Sci. 316, 1194–1199.
-
- Bethke, P.C., and Jones, R.L. (1998). Gibberellin signaling. Curr. Opin. Plant Biol. 1, 440–446. - PubMed
-
- Callis, J., and Vierstra, R.D. (2000). Protein degradation in signaling. Curr. Opin. Plant Biol. 3, 381–386. - PubMed
Publication types
MeSH terms
Substances
LinkOut - more resources
Full Text Sources
Other Literature Sources
Molecular Biology Databases
