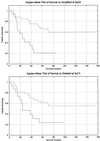
Quantitative analysis of chromosomal CGH in human breast tumors associates copy number abnormalities with p53 status and patient survival
- PMID: 11438741
- PMCID: PMC35449
- DOI: 10.1073/pnas.151241198
Quantitative analysis of chromosomal CGH in human breast tumors associates copy number abnormalities with p53 status and patient survival
Abstract
We present a general method for rigorously identifying correlations between variations in large-scale molecular profiles and outcomes and apply it to chromosomal comparative genomic hybridization data from a set of 52 breast tumors. We identify two loci where copy number abnormalities are correlated with poor survival outcome (gain at 8q24 and loss at 9q13). We also identify a relationship between abnormalities at two loci and the mutational status of p53. Gain at 8q24 and loss at 5q15-5q21 are linked with mutant p53. The 9q and 5q losses suggest the possibility of gene products involved in breast cancer progression. The analytical techniques are general and also are applicable to the analysis of array-based expression data.
Figures


Similar articles
-
TP53 mutations are associated with a particular pattern of genomic imbalances in breast carcinomas.J Pathol. 2005 Sep;207(1):14-9. doi: 10.1002/path.1812. J Pathol. 2005. PMID: 16007576
-
Global search for chromosomal abnormalities in infiltrating ductal carcinoma of the breast using array-comparative genomic hybridization.Cancer Genet Cytogenet. 2004 Dec;155(2):108-18. doi: 10.1016/j.cancergencyto.2004.02.023. Cancer Genet Cytogenet. 2004. PMID: 15571796
-
High resolution genomic analysis of sporadic breast cancer using array-based comparative genomic hybridization.Breast Cancer Res. 2005;7(6):R1186-98. doi: 10.1186/bcr1356. Epub 2005 Nov 24. Breast Cancer Res. 2005. PMID: 16457699 Free PMC article.
-
Mammary tumors in mice conditionally mutant for Brca1 exhibit gross genomic instability and centrosome amplification yet display a recurring distribution of genomic imbalances that is similar to human breast cancer.Oncogene. 2002 Aug 1;21(33):5097-107. doi: 10.1038/sj.onc.1205636. Oncogene. 2002. PMID: 12140760
-
[Microarray-based comparative genomic hybridization in the study of constitutional chromosomal abnormalities].Pathol Biol (Paris). 2007 Feb;55(1):13-8. doi: 10.1016/j.patbio.2006.04.002. Epub 2006 May 11. Pathol Biol (Paris). 2007. PMID: 16697120 Review. French.
Cited by
-
Role of p53 in breast cancer progression: An insight into p53 targeted therapy.Theranostics. 2023 Feb 27;13(4):1421-1442. doi: 10.7150/thno.81847. eCollection 2023. Theranostics. 2023. PMID: 36923534 Free PMC article. Review.
-
FGFR1 Amplification Mediates Endocrine Resistance but Retains TORC Sensitivity in Metastatic Hormone Receptor-Positive (HR+) Breast Cancer.Clin Cancer Res. 2019 Nov 1;25(21):6443-6451. doi: 10.1158/1078-0432.CCR-19-0138. Epub 2019 Aug 1. Clin Cancer Res. 2019. PMID: 31371343 Free PMC article.
-
Comparative oncogenomics identifies combinations of driver genes and drug targets in BRCA1-mutated breast cancer.Nat Commun. 2019 Jan 23;10(1):397. doi: 10.1038/s41467-019-08301-2. Nat Commun. 2019. PMID: 30674894 Free PMC article.
-
PIM1: a promising target in patients with triple-negative breast cancer.Med Oncol. 2017 Aug;34(8):142. doi: 10.1007/s12032-017-0998-y. Epub 2017 Jul 18. Med Oncol. 2017. PMID: 28721678 Review.
-
PVT1 dependence in cancer with MYC copy-number increase.Nature. 2014 Aug 7;512(7512):82-6. doi: 10.1038/nature13311. Epub 2014 Jun 22. Nature. 2014. PMID: 25043044 Free PMC article.
References
-
- Alizadeh A, Eisen M, Botstein D, Brown P O, Staudt L M. J Clin Immunol. 1998;18:373–379. - PubMed
-
- Tirkkonen M, Tanner M, Karhu R, Kallioniemi A, Isola J, Kallioniemi O P. Genes Chromosomes Cancer. 1998;21:177–184. - PubMed
-
- Pinkel D, Segraves R, Sudar S, Clark S, Poole I, Kowbel D, Collins C, Kuo W-L, Chen C, Zhai Z, et al. Nat Genet. 1998;20:207–211. - PubMed
-
- Bukholm I K, Nesland J M, Karesen R, Jacobsen U, Børresen-Dale A-L. J Pathol. 1997;181:140–145. - PubMed
Publication types
MeSH terms
Grants and funding
LinkOut - more resources
Full Text Sources
Other Literature Sources
Medical
Research Materials
Miscellaneous

