. 2001 Jul;75(13):5812-22.
doi: 10.1128/JVI.75.13.5812-5822.2001.

Human immunodeficiency virus type 1 (HIV-1)-induced GRO-alpha production stimulates HIV-1 replication in macrophages and T lymphocytes

Affiliations

Human immunodeficiency virus type 1 (HIV-1)-induced GRO-alpha production stimulates HIV-1 replication in macrophages and T lymphocytes

B R Lane et al. J Virol. 2001 Jul.

Abstract

We examined the early effects of infection by CCR5-using (R5 human immunodeficiency virus [HIV]) and CXCR4-using (X4 HIV) strains of HIV type 1 (HIV-1) on chemokine production by primary human monocyte-derived macrophages (MDM). While R5 HIV, but not X4 HIV, replicated in MDM, we found that the production of the C-X-C chemokine growth-regulated oncogene alpha (GRO-alpha) was markedly stimulated by X4 HIV and, to a much lesser extent, by R5 HIV. HIV-1 gp120 engagement of CXCR4 initiated the stimulation of GRO-alpha production, an effect blocked by antibodies to CXCR4. GRO-alpha then fed back and stimulated HIV-1 replication in both MDM and lymphocytes, and antibodies that neutralize GRO-alpha or CXCR2 (the receptor for GRO-alpha) markedly reduced viral replication in MDM and peripheral blood mononuclear cells. Therefore, activation of MDM by HIV-1 gp120 engagement of CXCR4 initiates an autocrine-paracrine loop that may be important in disease progression after the emergence of X4 HIV.


Figures

FIG. 1
FIG. 1
Increased production of GRO-α by MDM following encounter with HIV-1 is independent of productive infection. MDM were infected with equal counts of RT activity of HIV-1BaL or HIV-1BRU. (A) Extracellular immunoreactive GRO-α was measured by ELISA. (B) HIV replication was determined by quantitating the RT activity (above the background activity in uninfected controls) present in the supernatants. A portion of the supernatant was collected at several time points as indicated, so that input virus was removed entirely from the cells by day 2, at which point fresh medium was added, and a portion of the media (25%) was removed and replaced twice weekly. These experiments are representative of experiments performed with MDM from three different donors. (C) Exposure to X4 HIV (HIV-1BRU) stimulates GRO-α production by MDM to a greater extent than exposure to R5 HIV (HIV-1BAL). Shown are the results of ELISA for GRO-α performed on the supernatants collected 1 day after exposure of MDM from 11 different donors to HIV-1. Lines connect the values for control (no virus) and HIV-exposed MDM from each donor on this logarithmic scale. The horizontal black bars indicate the median values.
FIG. 1
FIG. 1
Increased production of GRO-α by MDM following encounter with HIV-1 is independent of productive infection. MDM were infected with equal counts of RT activity of HIV-1BaL or HIV-1BRU. (A) Extracellular immunoreactive GRO-α was measured by ELISA. (B) HIV replication was determined by quantitating the RT activity (above the background activity in uninfected controls) present in the supernatants. A portion of the supernatant was collected at several time points as indicated, so that input virus was removed entirely from the cells by day 2, at which point fresh medium was added, and a portion of the media (25%) was removed and replaced twice weekly. These experiments are representative of experiments performed with MDM from three different donors. (C) Exposure to X4 HIV (HIV-1BRU) stimulates GRO-α production by MDM to a greater extent than exposure to R5 HIV (HIV-1BAL). Shown are the results of ELISA for GRO-α performed on the supernatants collected 1 day after exposure of MDM from 11 different donors to HIV-1. Lines connect the values for control (no virus) and HIV-exposed MDM from each donor on this logarithmic scale. The horizontal black bars indicate the median values.
FIG. 2
FIG. 2
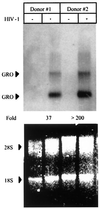
HIV-1 increases GRO mRNA levels in MDM. Total cellular RNA was extracted from control MDM (−) and MDM exposed to HIV-1BRU (+) after 2 days. RNA from two different donors was then analyzed for GRO gene expression by Northern (RNA) blot analysis using a GRO-specific probe (top panel). The total amount of RNA was determined by quantitating the intensity of the 28S and 18S rRNA bands (bottom panel). The amount of GRO mRNA was normalized to the amount of rRNA in each sample and the fold increase in HIV-exposed MDM relative to control MDM is indicated.
FIG. 3
FIG. 3
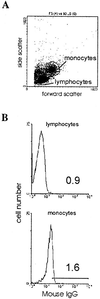
Intracellular GRO protein is present in monocytes exposed to HIV-1 and gp120. PBMC were treated with GolgiStop (Control) along with HIV-1BaL, HIV-1BRU, X4 gp120 (1 μg/ml, from HIV-1IIIB), Tat (100 ng/ml), or TNF-α (100 ng/ml). PBMC were harvested after 6 h and analyzed for intracellular GRO proteins by flow cytometry. (A) Lymphocyte and monocyte subpopulations were gated according to the pattern of forward scatter and side scatter. (B) Background staining in lymphocytes and monocytes was determined by incubation with PE-mouse IgG1 isotype control (mouse IgG). The histograms show fluorescence intensity on a logarithmic scale along the x axis and the number of events on the y axis. The percentage of cells staining positive in each condition is indicated. (C) Staining of lymphocytes and monocytes with a PE-conjugated mouse anti-human GRO antibody (GRO-PE) for each treatment condition is shown. The data shown are representative of four independent experiments.
FIG. 3
FIG. 3
Intracellular GRO protein is present in monocytes exposed to HIV-1 and gp120. PBMC were treated with GolgiStop (Control) along with HIV-1BaL, HIV-1BRU, X4 gp120 (1 μg/ml, from HIV-1IIIB), Tat (100 ng/ml), or TNF-α (100 ng/ml). PBMC were harvested after 6 h and analyzed for intracellular GRO proteins by flow cytometry. (A) Lymphocyte and monocyte subpopulations were gated according to the pattern of forward scatter and side scatter. (B) Background staining in lymphocytes and monocytes was determined by incubation with PE-mouse IgG1 isotype control (mouse IgG). The histograms show fluorescence intensity on a logarithmic scale along the x axis and the number of events on the y axis. The percentage of cells staining positive in each condition is indicated. (C) Staining of lymphocytes and monocytes with a PE-conjugated mouse anti-human GRO antibody (GRO-PE) for each treatment condition is shown. The data shown are representative of four independent experiments.
FIG. 4
FIG. 4
HIV-1 gp120 stimulates GRO-α production. (A) MDM were exposed to HIV-1BRU or treated with recombinant gp120 (1 μg/ml) from isolates HIV-193TH975 (R5), HIV-1CM235 (R5), HIV-1IIIB (X4), HIV-1MN (X4), or HIV-1 Tat (1 μg/ml), SDF-1α (0.5 μg/ml), RANTES (1.35 μg/ml), or LPS (1 μg/ml) as indicated. Supernatants were collected after 1 day and analyzed by ELISA for GRO-α. The data are shown on a logarithmic scale and are the mean (± the standard error of the mean) of the results of 3 to 13 independent experiments for each treatment. The data and data labels show the fold increase relative to untreated controls for each set of experiments. The absolute amount (in nanograms per milliliter) of GRO-α in each set of experiments ranged from: untreated controls, 0.002 to 4.0; LPS, 0.19 to 0.74; HIV-1 Tat, 0.015 to 0.051; gp12093TH975, 0.001 to 4.1; gp120CM235, 0.06 to 2.1; SDF-1α, 3.4 to 4; gp120IIIB, 0.5 to 30.9; gp120MN, 1.1 to 14.6; and HIV-1BRU, 0.851 to 114. (B) Pseudotyped, replication-incompetent HIV-1 was prepared by cotransfection of 293 cells with an env(−) HIV-1 provirus (HXBePLAP) and either VSV-G or gp120 from HIV-1HXB2 (X4 gp120). MDM were treated with 50% cell-free supernatants from transfected or mock-transfected 293 cells. ELISA was performed on supernatants collected 2 days after treatment. The data shown are representative of three experiments.
FIG. 5
FIG. 5
MDM produce greater amounts of GRO-α in response to HIV-1 than to adenovirus or EBV. MDM were infected with adenovirus strain DL7001, type I EBV Marmoset strain, or HIV-1BRU. The approximate number of viral particles added to 105 MDM is indicated. The data shown are the mean values of multiple wells of MDM from two donors.
FIG. 6
FIG. 6
GRO-α production is mediated by interaction of HIV-1 with CXCR4. (A) MDM were preincubated with antibodies (20 μg/ml) to CCR5 (2D7) or CXCR4 (12G5), each of which is known to neutralize HIV infection, or else mouse IgG (20 μg/ml) or no antibody as controls, and then exposed to either HIV-1BaL or HIV-1BRU. Supernatants were collected after 24 h and analyzed by ELISA. Several values fell below the limit of detection (dashed line). (B) MDM were preincubated with the same antibodies or with anti-CD4 (15 μg/ml) before exposure to the X4 isolate HIV-1HXB2. The data shown are representative of five independent experiments.
FIG. 7
FIG. 7
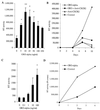
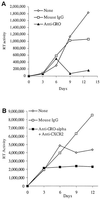
GRO-α stimulates HIV-1 replication in MDM and PBL. (A) MDM were treated with GRO-α at the indicated concentrations for 16 h before infection with HIV-1BaL. Supernatants were analyzed for RT activity 8 days after infection. (B) MDM were treated twice weekly with GRO-α (25 ng/ml) and/or anti-CXCR2 (20 μg/ml) starting 1 day before infection with HIV-1BaL. (C) CD8-depleted PBL were treated with GRO-α at the doses indicated 1 day before and 2 days after infection with HIV-1BaL. RT activity was assayed on day 5. (D) PBL were treated with GRO-α (25 ng/ml) 1 day before and 1 and 4 days after infection with HIV-1BRU. These experiments are representative of infections of cells from five (A), three (B), six (C), and seven (D) different donors.
FIG. 8
FIG. 8
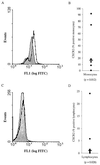
CXCR2 is expressed on monocytes and lymphocytes. PBMC were analyzed for CXCR2 expression by flow cytometry after 2 days. Monocytes (A and B) and lymphocytes (C and D) were gated according to forward and side scatter and, in some experiments, by the presence of CD4 or CD14. Histograms indicating the amount of staining with the mouse IgG control (filled gray) and with the anti-CXCR2 antibody (black line) are presented for monocytes (A) and lymphocytes (C). Data from multiple donors are presented as the percentage of cells staining positive with the anti-CXCR2 antibody minus the percentage of cells staining positive with the mouse IgG2a isotype control. Each point represents the value for a different donor monocytes, n = 8, (B); and lymphocytes, n = 6 (D). The horizontal black bars indicate the median values, which are 17.0 and 1.2%, respectively. The data were found to be statistically significant using the Wilcoxon signed rank test; P values are indicated below the data labels.
FIG. 9
FIG. 9
Involvement of endogenous GRO-α and CXCR2 signaling in HIV-1 replication in MDM and PBMC. (A) MDM were treated with mouse IgG1 (20 μg/ml) or anti-GRO (20 μg/ml) every 3 days starting 1 day before infection with HIV-1BaL. Media were collected and replenished every 3 days. (B) PBMC were stimulated with PHA (5 μg/ml) for 2 days and then infected with HIV-1BRU. Media were then aspirated, and PBMC were treated with mouse IgG (40 μg/ml) or anti-GRO-α and anti-CXCR2 (each at 20 μg/ml). Supernatants (25%) were collected every 3 days and replaced with fresh media containing antibodies. Cellular viability was assessed in this experiment on day 12 by MTT assay. The absorbance (A570-A650) was determined to be 0.323 ± 0.045 for no treatment, 0.262 ± 0.075 for mouse IgG, and 0.318 ± 0.026 for anti-GRO-α and anti-CXCR2. These experiments are representative of infections of cells from four (A) and three (B) different donors.

Similar articles

Cited by

References

    1. Ahuja S K, Murphy P M. The CXC chemokines growth-regulated oncogene (GRO)α, GROβ, GROγ, neutrophil-activating peptide-2, and epithelial cell-derived neutrophil-activating peptide-78 are potent agonists for the type B, but not the type A, human interleukin-8 receptor. J Biol Chem. 1996;271:20545–20550. - PubMed
    1. Alkhatib G, Combadiere C, Broder C C, Feng Y, Kennedy P E, Murphy P M, Berger E A. CC CKR5: a RANTES, MIP-1α, MIP-1β receptor as a fusion cofactor for macrophage-tropic HIV-1. Science. 1996;272:1955–1958. - PubMed
    1. Amara A, Gall S L, Schwartz O, Salamero J, Montes M, Loetscher P, Baggiolini M, Virelizier J L, Arenzana-Seisdedos F. HIV coreceptor downregulation as antiviral principle: SDF-1α-dependent internalization of the chemokine receptor CXCR4 contributes to inhibition of HIV replication. J Exp Med. 1997;186:139–146. - PMC - PubMed
    1. Anisowicz A, Bardwell L, Sager R. Constitutive overexpression of a growth-regulated gene in transformed Chinese hamster and human cells. Proc Natl Acad Sci USA. 1987;84:7188–7192. - PMC - PubMed
    1. Badley A D, Dockrell D, Simpson M, Schut R, Lynch D H, Leibson P, Paya C V. Macrophage-dependent apoptosis of CD4+ T lymphocytes from HIV-infected individuals is mediated by FasL and tumor necrosis factor. J Exp Med. 1997;185:55–64. - PMC - PubMed

Publication types

MeSH terms

LinkOut - more resources