. 2001 Apr 17;20(8):1910-20.
doi: 10.1093/emboj/20.8.1910.

Mitochondria-to-nucleus stress signaling induces phenotypic changes, tumor progression and cell invasion

Affiliations

Mitochondria-to-nucleus stress signaling induces phenotypic changes, tumor progression and cell invasion

G Amuthan et al. EMBO J. .

Abstract

Recently we showed that partial depletion of mitochondrial DNA (genetic stress) or treatment with mitochondrial-specific inhibitors (metabolic stress) induced a stress signaling that was associated with increased cytoplasmic-free Ca(2+) [Ca(2+)](c). In the present study we show that the mitochondria-to-nucleus stress signaling induces invasive phenotypes in otherwise non-invasive C2C12 myoblasts and human pulmonary carcinoma A549 cells. Tumor-specific markers cathepsin L and transforming growth factor beta (TGFbeta) are overexpressed in cells subjected to mitochondrial genetic as well as metabolic stress. C2C12 myoblasts subjected to stress showed 4- to 6-fold higher invasion through reconstituted Matrigel membrane as well as rat tracheal xenotransplants in Scid mice. Activation of Ca(2+)-dependent protein kinase C (PKC) under both genetic and metabolic stress conditions was associated with increased cathepsin L gene expression, which contributes to increased invasive property of cells. Reverted cells with approximately 70% of control cell mtDNA exhibited marker mRNA contents, cell morphology and invasive property closer to control cells. These results provide insights into a new pathway by which mitochondrial DNA and membrane damage can contribute to tumor progression and metastasis.


Figures
None
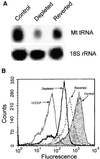
Fig. 1. Changes in mitochondrial membrane potential in mtDNA-depleted and reverted cells. (A) Mitochondrial tRNALeu levels in control, mtDNA-depleted and reverted C2C12 myoblasts, determined by northern blot analysis of total RNA (20 µg in each lane) using 32P-labeled DNA probe. The same blot was stripped and reprobed with 18S rRNA probe to assess the loading level. (B) Flow cytometry analysis of cells stained with mitochondrial-specific cationic dye, Mitotracker, as described in Materials and methods.
None
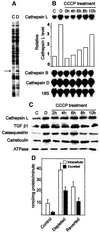
Fig. 2. Induction of cathepsin L during mitochondrial genetic and metabolic stress. (A) Differential display pattern showing induced level of cathepsin L mRNA in mtDNA-depleted cells. (B) Northern blots using cathepsin L cDNA probe (upper panel) and cathepsin B and D cDNA probes (lower panels) from control C2C12 cells (C) and mtDNA-depleted cells (D), and also cells treated with CCCP (25 µM) for the indicated time. In all panels 20 µg RNA was hybridized with 32P-labeled DNA probes under standard conditions. The blots were reprobed with 18S rRNA probe to ensure the RNA loading. (C) Immunoblot analysis of total cell extracts (50 µg protein in each case) from control and treated cells as indicated at the top. The blots were probed with indicated antibodies (1:1000 dilution) and developed using the Superglo kit from Pierce (Rockford, IL). The blots were reprobed with antibody against Na+/K+ ATPase to determine the protein loading level. The RNA and protein blots were quantified using a BioRad radiometric imager. (D) The level of intracellular and extracellular cathepsin L activity was assayed in total cell extract or concentrated culture fluid as described in Materials and methods. The values represent mean ± SEM of four experiments.
None
Fig. 3. Induced tumorigenicity of mtDNA-depleted C2C12 cells in vivo in Scid mice. (A) Hematoxylin–eosin stained sections of xenotransplants are shown. Control cells (a) that are growing inside the former tracheal lumen are shown by an arrowhead (invasion level 0). Panel b shows a representative in vivo growth pattern of mtDNA-depleted cells in a tracheal transplant. Note that the cells are growing inside the trachea as well as invading the external tracheal wall, as indicated by the arrow (invasion level 3–4). Panels c, d and e show the cellular differentiation pattern of control, mtDNA-depleted and reverted cells, respectively. The giant multinucleated rhabdomyoblasts (shown by arrows) are clearly seen in the control (c) and reverted cells (e). Such multinucleated cells are not seen in mtDNA-depleted cells (d). Bars in a and b represent 800 µm and those in c, d and e represent 100 µm. (B) The invasion levels of control, depleted and reverted cells from four different double blind assays are presented as bar diagrams. (C) Mitochondrial DNA contents of cells recovered from the representative sections of tracheal transplants as in (A). Total cell DNA (5 µg each) were subjected to Southern blot hybridization with mitochondrial-specific cytochrome oxidase I DNA probe. The blot was stripped and rehybridized with labeled probe for 18S rRNA probe to determine the loading level.
None
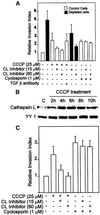
Fig. 4. Mitochondrial stress-induced cell invasion in C2C12 myoblasts and A549 lung carcinoma cells. In vitro Matrigel assays were carried out using 3H-labeled cells as described in Materials and methods. Treatment with indicated levels of CCCP and cyclosporin was carried out for 5 h, and other treatments were as described in Materials and methods. (AIn vitro invasion of C2C12 cells in Matrigel chambers. (B) Effects of CCCP on the induction cathepsin L protein in A549 cells. Immunoblot analysis of whole-cell extracts (50 µg protein each) was carried out with antibody to human cathepsin L (Santacruz Biotech., 1:1000 dilution). The blot was also reprobed with antibody to ubiquitous transcription factor YY1 as a loading control. (CIn vitro Matrigel invasion with treated and untreated A549 cells. The values represent mean ± SEM of four independent experiments.
None
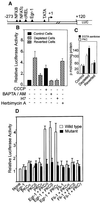
Fig. 5. Mechanism of activation of cathepsin L promoter by mitochondrial stress. (A) Structure of murine cathepsin L promoter and potential protein binding motifs based on nucleotide sequence. (B) Transcriptional activity of promoter construct in pGL3 reporter vector (Promega, Madison, WI). Details of transfection with reporter and renila luciferase as internal control and analysis of luciferase activity were as described in Materials and methods. Various agents as indicated were added to transfected cells also as described in Materials and methods. (C) PKC activity was assayed based on the level of inhibition with a PKC α, β and γ-specific pseudosubstrate inhibitor peptide. Ca2+-sensitive activity represents the level of inhibition with 5 mM EGTA. (D) Effects of coexpression with Egr-1 and PKC isoform-specific cDNAs on the transcriptional activity of the cathepsin L promoter in control C2C12 cells. Values represent the average ± SEM of 4–6 transfection assays in all cases.
None
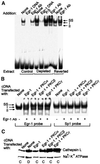
Fig. 6. Role of Ca2+-activated PKC on the activation of Egr-1 and endogenous cathepsin L gene expression. (A) Levels of Egr-1 DNA binding factors in the nuclear extracts from control, depleted and reverted (R) cells by gel mobility shift analysis (P.S, pre-immune serum; SS, supershifted). (B) Gel shift patterns with nuclear extracts from cells transfected with Egr-1 alone, and with PKCα, β or γ cDNAs. In each case, 7.5 µg of protein was used for DNA binding with Egr-1 DNA (left panel) and Sp1 DNA (right panel). (C) The western blot analysis of whole-cell extracts (50 µg each) from control C2C12 cells transfected with Egr-1 cDNA alone and with either PKC α, β or γ cDNAs. The blot was co-developed with antibody to cathepsin L and antibody to Na+/K+ ATPase as a loading control (C, control extracts; D, depleted extract).
None
Fig. 7. A model for the mitochondrial genetic and metabolic stress-mediated tumor invasion.

Similar articles

Cited by

References

    1. Allen J.A. and Coombs,M.M. (1980) Covalent binding of polycyclic aromatic compounds to mitochondrial and nuclear DNA. Nature, 287, 244–245. - PubMed
    1. Atkins K.B. and Troen,B.R. (1995) Phorbol ester stimulated cathepsin L expression in U937 cells. Cell Growth Differ., 6, 713–718. - PubMed
    1. Backer J.M. and Weinstein,I.B. (1980) Mitochondrial DNA is a major cellular target for a dihydrodiol-epoxide derivative of benzo[a]pyrene. Science, 209, 297–299. - PubMed
    1. Biswas G., Adebanjo,O.A., Freedman,B.D., Anandatheerthavarada, H.K., Vijayasarathy,C., Zaidi,M., Kotlikoff,M. and Avadhani,N.G. (1999) Retrograde Ca2+ signaling in C2C12 skeletal myocytes in response to mitochondrial genetic and metabolic stress: a novel mode of inter-organelle crosstalk. EMBO J., 18, 522–533. - PMC - PubMed
    1. Bossy-Wetzel E., Newmeyer,D.D. and Green,D.R. (1998) Mitochondrial cytochrome c release in apoptosis occurs upstream of DEVD-specific caspase activation and independently of mitochondrial transmembrane depolarization. EMBO J., 17, 37–49. - PMC - PubMed

Publication types

MeSH terms