Activation of latent Kaposi's sarcoma-associated herpesvirus by demethylation of the promoter of the lytic transactivator
- PMID: 11274437
- PMCID: PMC31189
- DOI: 10.1073/pnas.051004198
Activation of latent Kaposi's sarcoma-associated herpesvirus by demethylation of the promoter of the lytic transactivator
Abstract
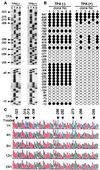
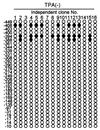
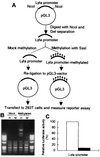
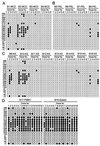
Kaposi's sarcoma-associated herpesvirus (KSHV) is strongly linked to Kaposi's sarcoma, primary effusion lymphomas, and a subset of multicentric Castleman's disease. The mechanism by which this virus establishes latency and reactivation is unknown. KSHV Lyta (lytic transactivator, also named KSHV/Rta), mainly encoded by the ORF 50 gene, is a lytic switch gene for viral reactivation from latency, inasmuch as it is both essential and sufficient to drive the entire viral lytic cycle. Here we show that the Lyta promoter region was heavily methylated in latently infected cells. Treatment of primary effusion lymphoma-delivered cell lines with tetradecanoylphorbol acetate caused demethylation of the Lyta promoter and induced KSHV lytic phase in vitro. Methylation cassette assay shows demethylation of the Lyta promoter region was essential for the expression of Lyta. In vivo, biopsy samples obtained from patients with KSHV-related diseases show the most demethylation in the Lyta promoter region, whereas samples from a latently infected KSHV carrier remained in a methylated status. These results suggest a relationship among a demethylation status in the Lyta promoter, the reactivation of KSHV, and the development of KSHV-associated diseases.
Figures


Similar articles
-
Reactivation of Kaposi's sarcoma-associated herpesvirus infection from latency by expression of the ORF 50 transactivator, a homolog of the EBV R protein.Virology. 1998 Dec 20;252(2):304-12. doi: 10.1006/viro.1998.9486. Virology. 1998. PMID: 9878608
-
Lytic but not latent infection by Kaposi's sarcoma-associated herpesvirus requires host CSL protein, the mediator of Notch signaling.Proc Natl Acad Sci U S A. 2003 Jul 8;100(14):8490-5. doi: 10.1073/pnas.1432843100. Epub 2003 Jun 27. Proc Natl Acad Sci U S A. 2003. PMID: 12832621 Free PMC article.
-
Intracellular-activated Notch1 can reactivate Kaposi's sarcoma-associated herpesvirus from latency.Virology. 2006 Aug 1;351(2):393-403. doi: 10.1016/j.virol.2006.03.047. Epub 2006 May 15. Virology. 2006. PMID: 16701788
-
Lytic cycle switches of oncogenic human gammaherpesviruses.Adv Cancer Res. 2007;97:81-109. doi: 10.1016/S0065-230X(06)97004-3. Adv Cancer Res. 2007. PMID: 17419942 Review.
-
Kaposi's sarcoma-associated herpesvirus (KSHV)/human herpesvirus 8 (HHV-8) as a tumour virus.Herpes. 2003 Dec;10(3):72-7. Herpes. 2003. PMID: 14759339 Review.
Cited by
-
Suppression of TLR9 immunostimulatory motifs in the genome of a gammaherpesvirus.J Immunol. 2011 Jul 15;187(2):887-96. doi: 10.4049/jimmunol.1003737. Epub 2011 Jun 10. J Immunol. 2011. PMID: 21666062 Free PMC article.
-
The Impact of Co-Infections for Human Gammaherpesvirus Infection and Associated Pathologies.Int J Mol Sci. 2023 Aug 22;24(17):13066. doi: 10.3390/ijms241713066. Int J Mol Sci. 2023. PMID: 37685871 Free PMC article. Review.
-
Recent Advances in Developing Treatments of Kaposi's Sarcoma Herpesvirus-Related Diseases.Viruses. 2021 Sep 9;13(9):1797. doi: 10.3390/v13091797. Viruses. 2021. PMID: 34578378 Free PMC article. Review.
-
Establishing and characterizing a new primary effusion lymphoma cell line harboring Kaposi's sarcoma-associated herpesvirus.Infect Agent Cancer. 2016 Aug 17;11:37. doi: 10.1186/s13027-016-0086-5. eCollection 2016. Infect Agent Cancer. 2016. PMID: 27536332 Free PMC article.
-
Methylation effect on chalcone synthase gene expression determines anthocyanin pigmentation in floral tissues of two Oncidium orchid cultivars.Planta. 2012 Aug;236(2):401-9. doi: 10.1007/s00425-012-1616-z. Epub 2012 Mar 6. Planta. 2012. PMID: 22391855
References
-
- Chang Y, Cesarman E, Pessin M S, Lee F, Culpepper J, Knowles D M, Moore P S. Science. 1994;266:1865–1869. - PubMed
-
- Soulier J, Grollet L, Oksenhendler E, Cacoub P, Cazals-Hatem D, Babinet P, d'Agay M F, Clauvel J P, Raphael M, Degos L, et al. Blood. 1995;86:1276–1280. - PubMed
-
- Cesarman E, Chang Y, Moore P S, Said J W, Knowles D M N. N Engl J Med. 1995;332:1186–1191. - PubMed
Publication types
MeSH terms
Substances
LinkOut - more resources
Full Text Sources

