. 2001 Mar 15;20(6):1320-30.
doi: 10.1093/emboj/20.6.1320.

Kinetic analysis of translocation through nuclear pore complexes

Affiliations

Kinetic analysis of translocation through nuclear pore complexes

K Ribbeck et al. EMBO J. .

Abstract

The mechanism of facilitated translocation through nuclear pore complexes (NPCs) is only poorly understood. Here, we present a kinetic analysis of the process using various model substrates. We find that the translocation capacity of NPCs is unexpectedly high, with a single NPC allowing a mass flow of nearly 100 MDa/s and rates in the order of 10(3) translocation events per second. Our data further indicate that high affinity interactions between the translocation substrate and NPC components are dispensable for translocation. We propose a 'selective phase model' that could explain how NPCs function as a permeability barrier for inert molecules and yet become selectively permeable for nuclear transport receptors and receptor-cargo complexes.


Figures
None
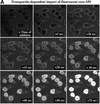
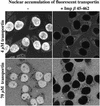
Fig. 1. Transportin—a simple model substrate for facilitated translocation through NPCs. Alexa-labelled transportin (4 or 70 µM) was added to permeabilized cells and its distribution subsequently recorded by scanning with a confocal microscope through the unfixed samples. One minute was sufficient for a clear nuclear accumulation of transportin (left). The dominant-negative importin β 45–462 mutant (3 µM) blocked the transportin influx completely (right).
None
Fig. 2. Time course of transportin influx into nuclei. Fluorescent transportin (4 µM) was added to the permeabilized cells and its influx into nuclei recorded in real time by confocal microscopy. (A) Frames taken at indicated time points. (B) Integrated nuclear fluorescence (excluding the NPC signal) is plotted against time. The time course fits an exponential curve of the form f[t] = fMax(1 – e–kt), where t is time, f[t] is the nuclear fluorescence, fMax is the endpoint of the reaction and k is the first-order rate constant. For conversion of fluorescence intensities into absolute substrate concentration see Materials and methods. The initial rate of nuclear accumulation (given by ri = kfMax) for 4 µM transportin was found to be 0.6 µM/s, corresponding to ∼150 translocations·NPC–1·s–1 (average from 10 independent measurements).
None
Fig. 3. Concentration dependence of transportin flux through NPCs. The initial rates of influx of fluorescent transportin were determined for concentrations of 0.85–68 µM (42 data points). A saturation of influx by increasing transportin concentrations is clearly evident. However, the dose dependence deviates from an ideal Michaelis–Menten curve of the form v = VMaxc/(KM + c), apparently because cooperativity in NPC passage becomes significant at higher transportin concentration. The fit was improved by introducing a correction factor (1 + k2c), which takes cooperativity into account and gives a modified Michaelis–Menten equation of the form The numerically obtained best-fit parameters are: VMax = 300 events·NPC–1·s–1; KM = 4 µM; k2 = 0.03 µM–1.
None
Fig. 4. Rate of core–M9 import into nuclei. The pentameric core–M9 fusion (Alexa labelled) was complexed with transportin at a 1:5 molar ratio. Import into nuclei was with 1 µM of this 630 kDa complex in the presence of Ran and an energy-regenerating system. (A) Time lapse images of M9 import. (B) Plot of integrated nuclear fluorescence (nuclear core–M9 concentration) versus time. The initial rate of nuclear accumulation was 0.11 µM/s, corresponding to 28 translocations·NPC–1·s–1 or a mass flow of ∼17 MDa·NPC–1·s–1.
None
Fig. 5. Comparison of NTF2 flux through NPCs with that of GFP. (A) Comparison of influx of GFP (5 µM), wild-type NTF2 (2.5 µM dimers) and the NTF2 W7R mutant into nuclei. Note that NTF2 nearly instantaneously equilibrated between nucleus and cytoplasm, while GFP remained excluded from the nuclei when tested on the same time scale. Endpoints were 2 min for GFP, 12 s for wild-type NTF2 and 60 s for the NTF2 W7R mutant. (B) Quantitation of NTF2 (wild type) influx into nuclei. Equilibration between the nuclear and cytoplasmic NTF2 pools occurs with a first-order rate constant of k = 1 s–1 or a half-time of ∼0.7 s. This implies that a nucleocytoplasmic concentration difference of 2.5 µM causes a change in nuclear NTF2 concentration at an initial rate of 2.5 µM/s, which corresponds to a flux of ∼620 NTF2 dimers·NPC–1·s–1 (for details see Supplementary data).
None
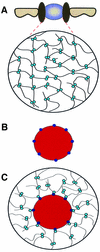
Fig. 6. The selective phase model for facilitated translocation through NPCs. (A) The permeability barrier of the central plug ‘at rest’. Phe-rich nucleoporin repeats (light blue circles) attract each other and form a meshwork that restricts passage of inert objects. (B) An object capable of facilitated translocation, distinguished from inert objects by binding sites (dark blue circles) for the Phe-rich repeats. (C) The translocating species interacts with the Phe-rich repeats and thus becomes part of the meshwork. It dissolves in the central plug, which allows crossing of the permeability barrier.

Similar articles

Cited by

References

    1. Adam S.A., Marr,R.S. and Gerace,L. (1990) Nuclear protein import in permeabilized mammalian cells requires soluble cytoplasmic factors. J. Cell Biol., 111, 807–816. - PMC - PubMed
    1. Akey C.W. and Goldfarb,D.S. (1989) Protein import through the nuclear pore complex is a multistep process. J. Cell Biol., 109, 971–982. - PMC - PubMed
    1. Akey C.W. and Radermacher,M. (1993) Architecture of the Xenopus nuclear pore complex revealed by three-dimensional cryo-electron microscopy. J. Cell Biol., 122, 1–19. - PMC - PubMed
    1. Bachi A. et al. (2000) The C-terminal domain of TAP interacts with the nuclear pore complex and promotes export of specific CTE-bearing RNA substrates. RNA, 6, 136–158. - PMC - PubMed
    1. Bayliss R., Ribbeck,K., Akin,D., Kent,H.M., Feldherr,C.M., Görlich,D. and Stewart,M. (1999) Interaction between NTF2 and xFxFG-containing nucleoporins is required to mediate nuclear import of RanGDP. J. Mol. Biol., 293, 579–593. - PubMed

Publication types