

Spectral karyotyping suggests additional subsets of colorectal cancers characterized by pattern of chromosome rearrangement
- PMID: 11226274
- PMCID: PMC30173
- DOI: 10.1073/pnas.041603298
Spectral karyotyping suggests additional subsets of colorectal cancers characterized by pattern of chromosome rearrangement
Abstract
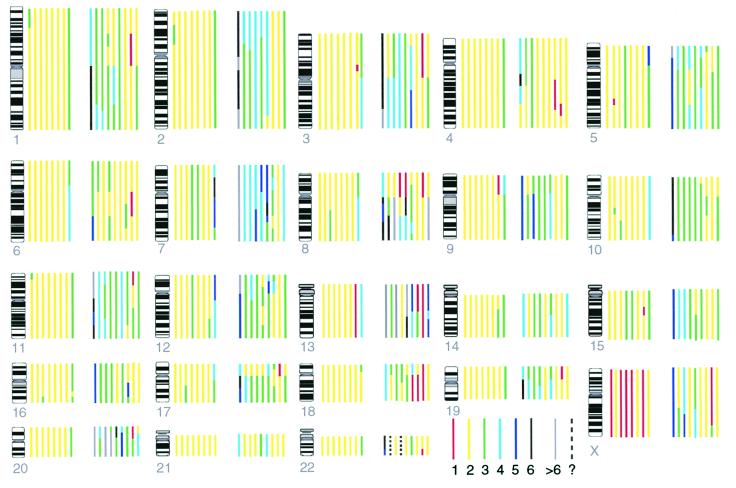
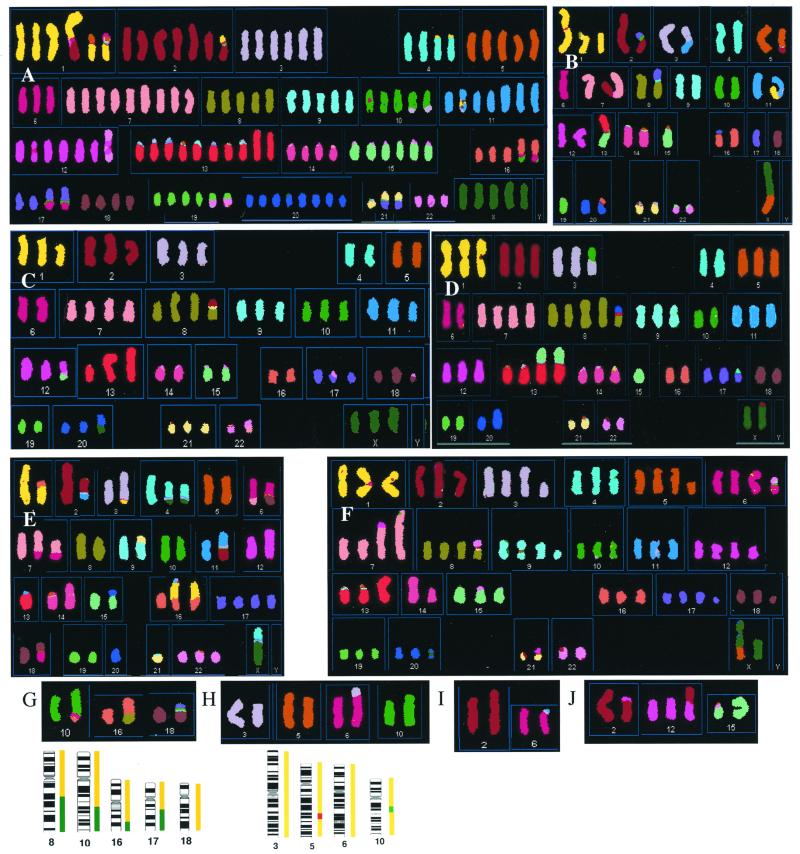
The abundant chromosome abnormalities in most carcinomas are probably a reflection of genomic instability present in the tumor, so the pattern and variability of chromosome abnormalities will reflect the mechanism of instability combined with the effects of selection. Chromosome rearrangement was investigated in 17 colorectal carcinoma-derived cell lines. Comparative genomic hybridization showed that the chromosome changes were representative of those found in primary tumors. Spectral karyotyping (SKY) showed that translocations were very varied and mostly unbalanced, with no translocation occurring in more than three lines. At least three karyotype patterns could be distinguished. Some lines had few chromosome abnormalities: they all showed microsatellite instability, the replication error (RER)+ phenotype. Most lines had many chromosome abnormalities: at least seven showed a surprisingly consistent pattern, characterized by multiple unbalanced translocations and intermetaphase variation, with chromosome numbers around triploid, 6-16 structural aberrations, and similarities in gains and losses. Almost all of these were RER-, but one, LS411, was RER+. The line HCA7 showed a novel pattern, suggesting a third kind of genomic instability: multiple reciprocal translocations, with little numerical change or variability. This line was also RER+. The coexistence in one tumor of two kinds of genomic instability is to be expected if the underlying defects are selected for in tumor evolution.
Figures

Similar articles
-
Definitive molecular cytogenetic characterization of 15 colorectal cancer cell lines.Genes Chromosomes Cancer. 2010 Mar;49(3):204-23. doi: 10.1002/gcc.20730. Genes Chromosomes Cancer. 2010. PMID: 19927377 Free PMC article.
-
Chromosome number and structure both are markedly stable in RER colorectal cancers and are not destabilized by mutation of p53.Oncogene. 1998 Aug 13;17(6):719-25. doi: 10.1038/sj.onc.1201986. Oncogene. 1998. PMID: 9715273
-
Spectral karyotyping analysis of head and neck squamous cell carcinoma.Laryngoscope. 2001 Sep;111(9):1545-50. doi: 10.1097/00005537-200109000-00010. Laryngoscope. 2001. PMID: 11568603
-
Advances in the detection of chromosomal aberrations using spectral karyotyping.Clin Genet. 2001 Feb;59(2):65-73. doi: 10.1034/j.1399-0004.2001.590201.x. Clin Genet. 2001. PMID: 11260203 Review.
-
Molecular cytogenetics: genomic imbalances in colorectal cancer and their clinical impact.Cell Oncol. 2006;28(3):71-84. doi: 10.1155/2006/173815. Cell Oncol. 2006. PMID: 16823176 Free PMC article. Review.
Cited by
-
Neotelomeres and Telomere-Spanning Chromosomal Arm Fusions in Cancer Genomes Revealed by Long-Read Sequencing.bioRxiv [Preprint]. 2023 Dec 1:2023.11.30.569101. doi: 10.1101/2023.11.30.569101. bioRxiv. 2023. Update in: Cell Genom. 2024 Jul 10;4(7):100588. doi: 10.1016/j.xgen.2024.100588. PMID: 38077026 Free PMC article. Updated. Preprint.
-
Activation of Saccharomyces cerevisiae Mlh1-Pms1 Endonuclease in a Reconstituted Mismatch Repair System.J Biol Chem. 2015 Aug 28;290(35):21580-90. doi: 10.1074/jbc.M115.662189. Epub 2015 Jul 13. J Biol Chem. 2015. PMID: 26170454 Free PMC article.
-
Mitotic checkpoint function in the formation of gross chromosomal rearrangements in Saccharomyces cerevisiae.Proc Natl Acad Sci U S A. 2004 Nov 9;101(45):15980-5. doi: 10.1073/pnas.0407010101. Epub 2004 Oct 28. Proc Natl Acad Sci U S A. 2004. PMID: 15514023 Free PMC article.
-
The catalytic subunit of DNA-dependent protein kinase regulates proliferation, telomere length, and genomic stability in human somatic cells.Mol Cell Biol. 2008 Oct;28(20):6182-95. doi: 10.1128/MCB.00355-08. Epub 2008 Aug 18. Mol Cell Biol. 2008. PMID: 18710952 Free PMC article.
-
Chromosomes and cancer cells.Chromosome Res. 2011 Apr;19(3):433-44. doi: 10.1007/s10577-010-9179-y. Chromosome Res. 2011. PMID: 21190130 Free PMC article. Review.
References
-
- Dutrillaux B. Adv Cancer Res. 1995;67:59–82. - PubMed
-
- Lengauer C, Kinzler K W, Vogelstein B. Nature (London) 1998;396:643–649. - PubMed
-
- Leach F S, Polyak K, Burrell M, Johnson K A, Hill D, Dunlop M G, Wyllie A H, Peltomaki P, de la Chapelle A, Hamilton S R, et al. Cancer Res. 1996;56:235–240. - PubMed
Publication types
MeSH terms
Grants and funding
LinkOut - more resources
Full Text Sources
Other Literature Sources
Medical
Research Materials
