

Quantitative analysis of mRNA amplification by in vitro transcription
- PMID: 11222780
- PMCID: PMC29742
- DOI: 10.1093/nar/29.5.e29
Quantitative analysis of mRNA amplification by in vitro transcription
Abstract
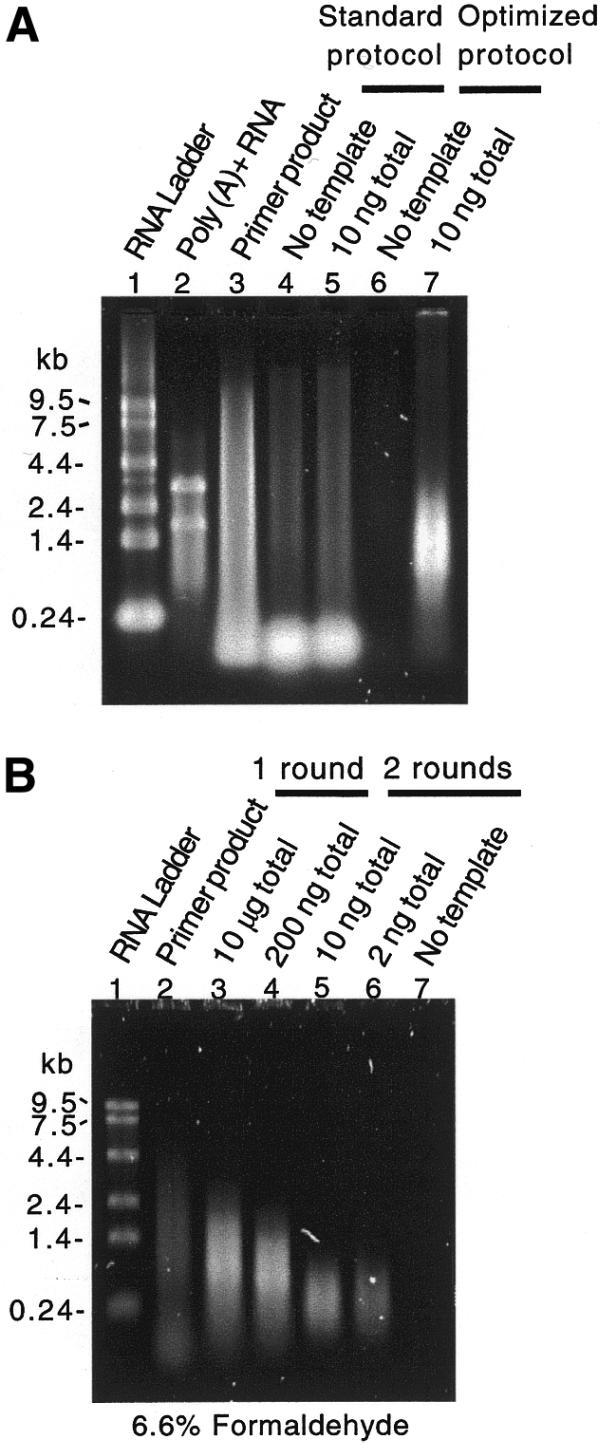
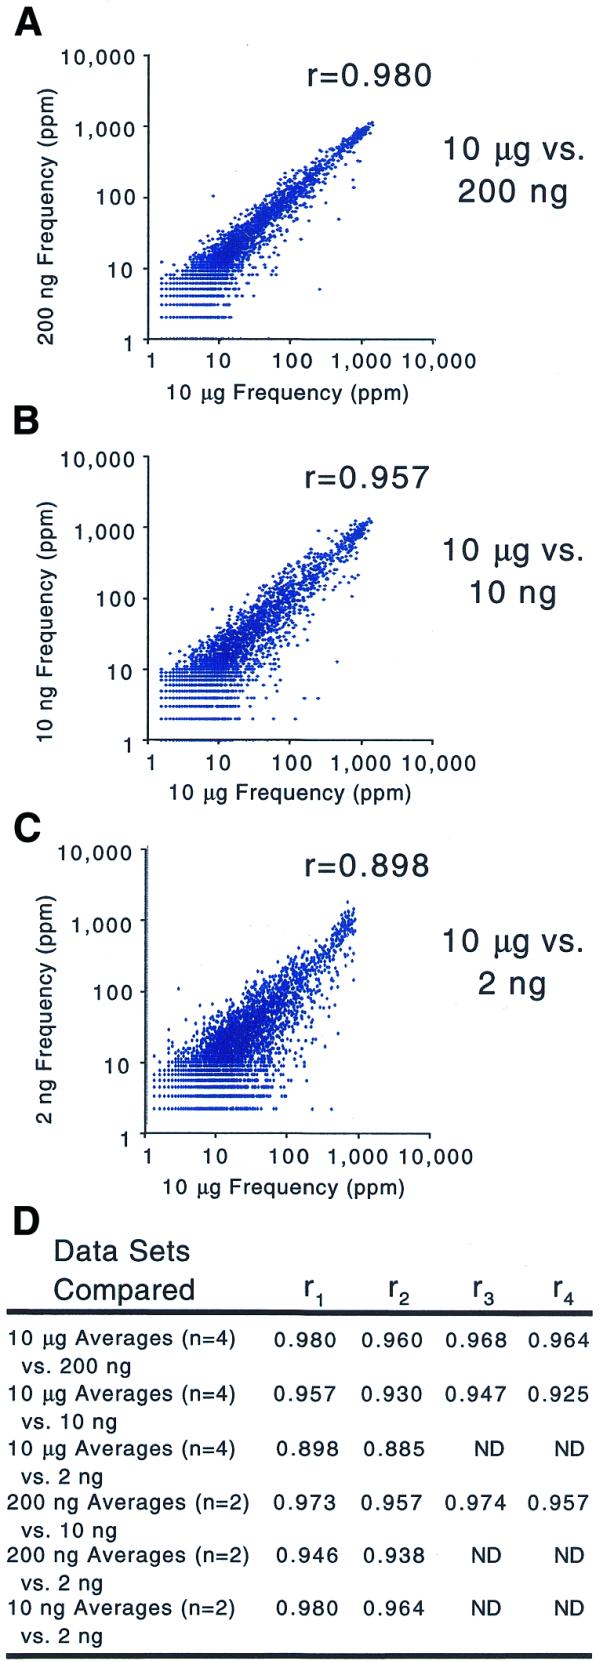
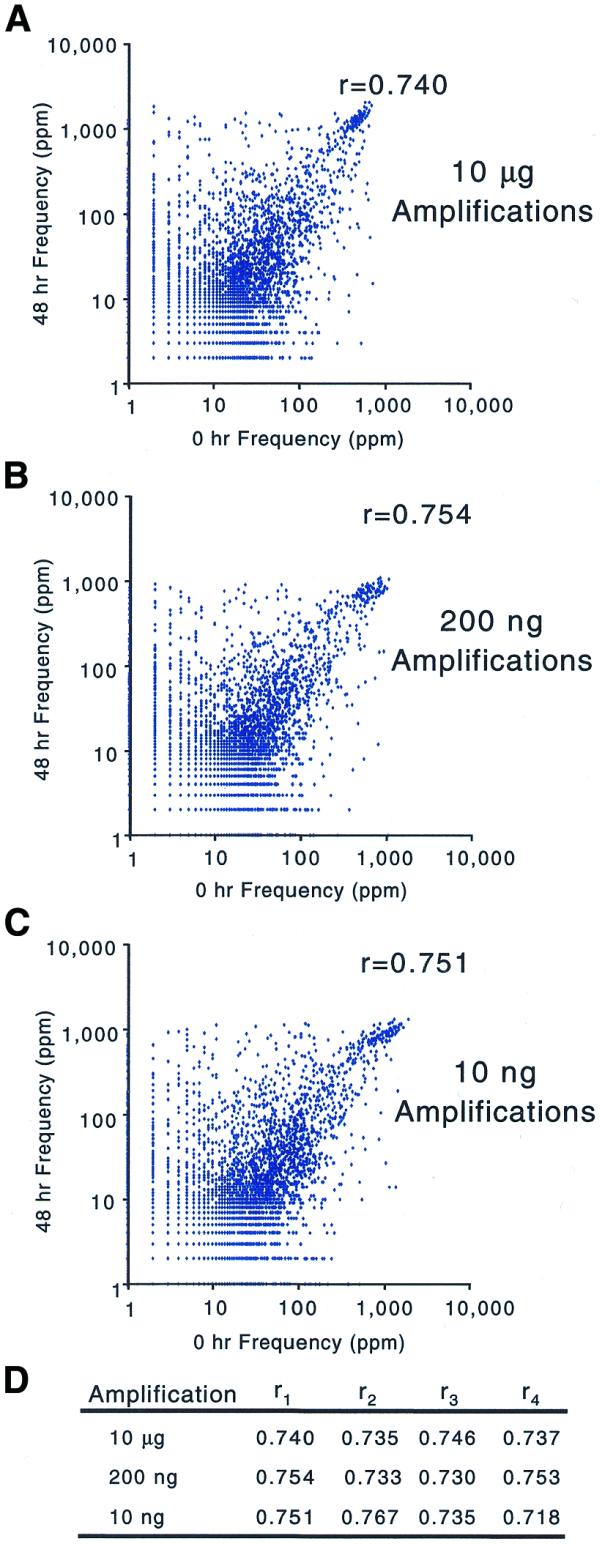
Effective transcript profiling in animal systems requires isolation of homogenous tissue or cells followed by faithful mRNA amplification. Linear amplification based on cDNA synthesis and in vitro transcription is reported to maintain representation of mRNA levels, however, quantitative data demonstrating this as well as a description of inherent limitations is lacking. We show that published protocols produce a template-independent product in addition to amplifying real target mRNA thus reducing the specific activity of the final product. We describe a modified amplification protocol that minimizes the generation of template-independent product and can therefore generate the desired microgram quantities of message-derived material from 100 ng of total RNA. Application of a second, nested round of cDNA synthesis and in vitro transcription reduces the required starting material to 2 ng of total RNA. Quantitative analysis of these products on Caenorhabditis elegans Affymetrix GeneChips shows that this amplification does not reduce overall sensitivity and has only minor effects on fidelity.
Figures


Similar articles
-
Amplification of mRNA populations by a cDNA tag strategy.Biotechniques. 2004 Feb;36(2):253-9. doi: 10.2144/04362ST02. Biotechniques. 2004. PMID: 14989090
-
Effective transcriptome amplification for expression profiling on sense-oriented oligonucleotide microarrays.Nucleic Acids Res. 2005 Feb 17;33(3):e29. doi: 10.1093/nar/gni029. Nucleic Acids Res. 2005. PMID: 15718295 Free PMC article.
-
Limitations of mRNA amplification from small-size cell samples.BMC Genomics. 2005 Oct 27;6:147. doi: 10.1186/1471-2164-6-147. BMC Genomics. 2005. PMID: 16253144 Free PMC article.
-
Transcriptome amplification methods in gene expression profiling.Expert Rev Mol Diagn. 2006 May;6(3):465-80. doi: 10.1586/14737159.6.3.465. Expert Rev Mol Diagn. 2006. PMID: 16706747 Review.
-
The promise of transcription profiling for understanding the pathogenesis of scleroderma.Curr Rheumatol Rep. 2000 Dec;2(6):506-11. doi: 10.1007/s11926-000-0028-4. Curr Rheumatol Rep. 2000. PMID: 11123105 Review.
Cited by
-
The Role of ZEB2 in Human CD8 T Lymphocytes: Clinical and Cellular Immune Profiling in Mowat-Wilson Syndrome.Int J Mol Sci. 2021 May 18;22(10):5324. doi: 10.3390/ijms22105324. Int J Mol Sci. 2021. PMID: 34070208 Free PMC article.
-
Medullary epithelial cells of the human thymus express a highly diverse selection of tissue-specific genes colocalized in chromosomal clusters.J Exp Med. 2004 Jan 19;199(2):155-66. doi: 10.1084/jem.20031677. J Exp Med. 2004. PMID: 14734521 Free PMC article.
-
Isogene specific oligo arrays reveal multifaceted changes in gene expression during grape berry (Vitis vinifera L.) development.Planta. 2005 Nov;222(5):832-47. doi: 10.1007/s00425-005-0017-y. Epub 2005 Sep 6. Planta. 2005. PMID: 16151847
-
RNA expression profiling at the single molecule level.Genome Res. 2006 Aug;16(8):1041-5. doi: 10.1101/gr.4999906. Epub 2006 Jun 29. Genome Res. 2006. PMID: 16809670 Free PMC article.
-
An improved single-cell cDNA amplification method for efficient high-density oligonucleotide microarray analysis.Nucleic Acids Res. 2006 Mar 17;34(5):e42. doi: 10.1093/nar/gkl050. Print 2006. Nucleic Acids Res. 2006. PMID: 16547197 Free PMC article.
References
-
- DeRisi J.L., Iyer,V.R. and Brown,P.O. (1997) Exploring the metabolic and genetic control of gene expression on a genomic scale. Science, 278, 680–686. - PubMed
-
- Chu S., DeRisi,J., Eisen,M.B., Mulholland,J., Botstein,D., Brown,P.O. and Herskowitz,I. (1998) The transcriptional program of sporulation in budding yeast. Science, 282, 699–705. - PubMed
-
- Iyer V.R., Eisen,M.B., Ross,D.T., Schuler,G., Moore,T., Lee,J.C.F., Trent,J.M., Staudt,L.M., Hudson,J., Boguski,M.S. et al. (1999) The transcriptional program in the response of human fibroblasts to serum. Science, 283, 83–87. - PubMed
Publication types
MeSH terms
Substances
LinkOut - more resources
Full Text Sources
Other Literature Sources
