. 2001 Jan 15;21(2):462-76.
doi: 10.1523/JNEUROSCI.21-02-00462.2001.

Quantitative relationship between transmitter release and calcium current at the calyx of held synapse

Affiliations

Quantitative relationship between transmitter release and calcium current at the calyx of held synapse

T Sakaba et al. J Neurosci. .

Abstract

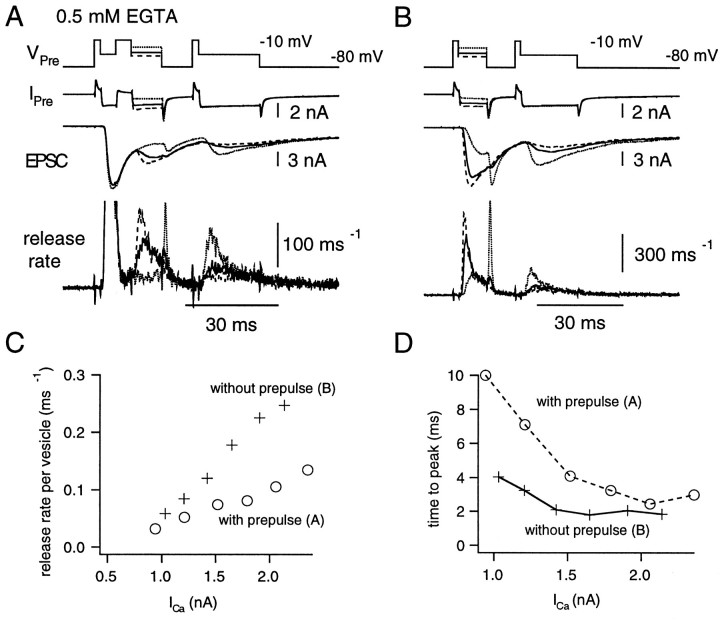
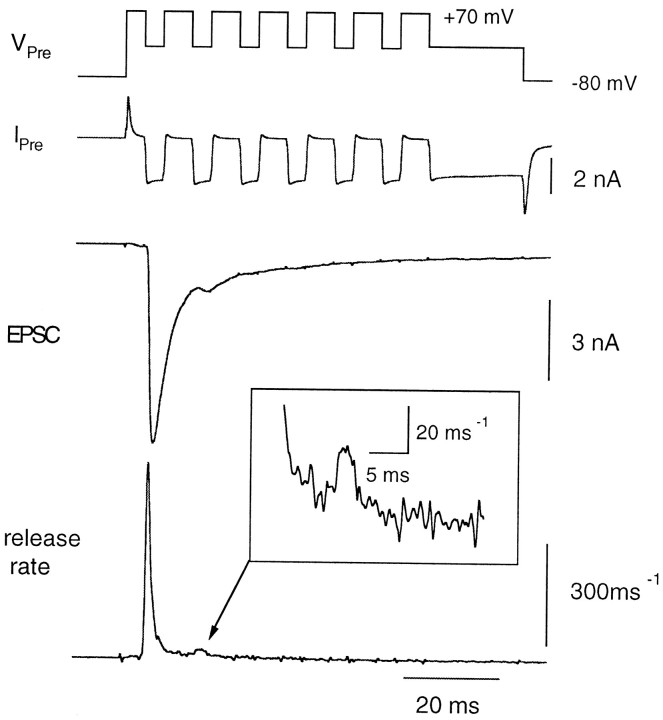
A newly developed deconvolution method (Neher and Sakaba, 2001) allowed us to resolve the time course of neurotransmitter release at the calyx of Held synapse and to quantify some basic aspects of transmitter release. First, we identified a readily releasable pool (RRP) of synaptic vesicles. We found that the size of the RRP, when tested with trains of strong stimuli, was constant regardless of the exact stimulus patterns, if stimuli were confined to a time interval of approximately 60 msec. For longer-lasting stimulus patterns, recruitment of new vesicles to the RRP made a substantial contribution to the total release. Second, the cooperativity of transmitter release as a function of Ca(2+) current was estimated to be 3-4, which confirmed previous results (Borst and Sakmann, 1999; Wu et al., 1999). Third, an initial small Ca(2+) influx increased the efficiency of Ca(2+) currents in subsequent transmitter release. This type of facilitation was blocked by a high concentration of EGTA (0.5 mm). Fourth, the release rates of synaptic vesicles at this synapse turned out to be heterogeneous: once a highly Ca(2+)-sensitive population of vesicles was consumed, the remaining vesicles released at lower rates. These components of release were more clearly separated in the presence of 0.5 mm EGTA, which prevented the buildup of residual Ca(2+). Conversely, raising the extracellular Ca(2+) concentration facilitated the slower population such that its release characteristics became more similar to those of the faster population under standard conditions. Heterogeneous release probabilities are expected to support the maintenance of synaptic transmission during high-frequency stimulation.


Figures

Fig. 1.
Fig. 1.
The effect of cyclothiazide (CTZ) on the NMDA EPSC. A, The presynaptic terminal was depolarized from −80 to +80 mV and repetitively shifted back to +20 mV every 8 msec for 2 msec. After repeating this stimulus six times, the terminal was held at 0 mV for 10 msec (VPre). The Ca2+currents (middle) and the NMDA EPSCs (bottom) before and after the application of CTZ (100 μm) were superimposed. The NMDA EPSC was isolated by application of 1 μm NBQX and 10 μm glycine, and the postsynaptic neuron was held at +60 mV. Strychnine (2 μm) was also applied to avoid responses to glycine.B, Left to right, The EPSC amplitude evoked by the first pulse (1st pulse), the second pulse (2nd pulse), the EPSC amplitude achieved at the end of the stimulus protocol (total response), and the paired-pulse ratio [ratio between the second pulse and the first pulse (2nd/1st)]. In all cases, quantities indicated were measured both before and after the application of CTZ. Ratios of these values before and after the application of CTZ are plotted (n = 5 cell pairs).
Fig. 2.
Fig. 2.
The deconvolution method to estimate quantal release rates at the calyx of Held. A, The fitting protocol to determine parameters of the glutamate diffusion model. The presynaptic voltage (VPre) was shifted from −80 to +70 mV and then repolarized to 0 mV (1–10 msec in duration) several times. IPre denotes presynaptic voltage-clamp current, which represents mainly Ca2+ current, not corrected for leak and capacitance current. Durations of these repolarizations were adjusted so that the size of EPSCs varied several-fold. Filtered variance (variance, solid line) was used to estimate release rates during the EPSC decay (Neher and Sakaba, 2001). The dotted line in the variance trace indicates an estimate of AMPA receptor channel noise (Neher and Sakaba, 2001). The difference between the total variance and channel noise should arise from fluctuations associated with quantal release. Parameters of the glutamte diffusion model, which accounts for the residual current caused by delayed clearance of glutamate (Neher and Sakaba, 2001), were determined from EPSC decay phases. After subtracting the residual current component (dotted line on the EPSC trace) from the total EPSCs, release rates (release rate, bottom) were calculated by deconvolution of the remaining EPSC with the mEPSC. The presynaptic patch pipette contained 0.05 mm BAPTA. B, Release rates during trains of pulses. The presynaptic terminal was depolarized from −80 to +70 mV and repetitively shifted back to −5 mV every 10 msec for 4 msec. After repeating this stimulus six times, the terminal was held at −5 mV for 20 msec to deplete the RRP. Release rates were calculated after subtracting the residual current component (dotted line in the EPSC trace) from the total EPSC. Variance associated with EPSCs and channel variance (dotted line) are also shown. The data were obtained from the same cell pair as shown in A.
Fig. 3.
Fig. 3.
Relationship between release rate and Ca2+ influx. A, A protocol similar to that described in Figure 2B was used, except that pulse durations were kept constant and the magnitude of repolarization was varied in each train of pulses, thereby varying amounts of Ca2+ influx. Four sweeps were superimposed. Different colors represent the different sweeps in the traces for VPre,IPre, EPSC, and theRelease Rate. The data were obtained from the same cell pair as shown in Figure 2. Details of the presynaptic inward currents evoked by the first pulse in each record are shown in theinset between the two bottom-most traces. These records have not been corrected for leak and capacitive transients (see Materials and Methods). B, The number of vesicles released during the stimulation protocol was calculated by integrating the release rate. The release rate was integrated from the end of the depleting pulse to the beginning of the protocol. Therefore, this figure shows the number of remaining vesicles. We assumed that new synaptic vesicles were recruited to the RRP with a time constant of 1 sec, calculating the integral according to Equation 2. The individual traces correspond to those of A, using the samecolor code. C, The release rates per vesicle during the first three pulses, calculated according to Equation5, are shown. The traces correspond to those ofA, using the same colors.
Fig. 4.
Fig. 4.
Relationship between Ca2+influx and the peak release rate per vesicle. A, The peak release rates per vesicle during the first (+), second (○), and third pulses (●), calculated from the data shown in Figure 3, are plotted against peak Ca2+ current. The data could be fitted with a Hill function (Eq. 7). First pulses were fitted with ξmax = 0.76 msec1, K = 1320 pA, n = 3.19. Second pulses were fitted with ξmax = 0.35 msec1, K = 686 pA, n = 3.31. Third pulses were fitted with ξmax = 0.34 msec1, K = 704 pA, n = 2.36. B, Summary of the relationship between the peak release rate per vesicle during the first (continuous line), second (broken line), and third (dotted line) pulses and the amplitude of Ca2+ current (n = 7 cell pairs). Presynaptic patch pipettes contained 0.05 mm BAPTA.C, Summary of the relationships between the peak release rate per vesicle and the amplitude of Ca2+ current during the first (continuous line), second (broken line), and third (dotted line) pulses. The presynaptic patch pipette contained 0.05 mmEGTA.
Fig. 5.
Fig. 5.
The effect of 0.5 mm EGTA on release rates per vesicle. A, The same protocols as described in Figure 3 were used. However, the presynaptic patch pipette contained 0.5 mm EGTA. Release rates observed during the depleting pulse are shown at two different magnifications. Note that the Ca2+ tail current at the end of the depleting pulse (indicated by a short artifact in the inset) does not lead to any changes in release rate. B, The relationship between the peak release rate per vesicle and the amplitude of the Ca2+ current. The data are from the cell pair shown in A. The peak values of release rate per vesicle during the first (continuous line), second (broken line), and third (dotted line) pulses were plotted against the amplitude of Ca2+ current. First pulses could be fitted with a power relationship (Eq. 8) withn = 2.43. Second and third pulses were fitted with a Hill function (second pulse: ξmax = 0.12 msec1; K = 739 pA; n = 3.42; third pulse: ξmax = 0.13 msec1; K = 204 pA; n = 0.916). C, Summary of the relationship between the peak release rate per vesicle during the first (continuous line), second (broken line), and third (dotted line) pulses and the amplitude of Ca2+ current. The presynaptic patch pipette contained 0.5 mm EGTA (n = 4 cell pairs).
Fig. 6.
Fig. 6.
The effect of 0.2 mm BAPTA on release rates per vesicle. The same stimulus protocols as described in Figure 3were used, and the peak values of release rate per vesicle during the first (continuous line), second (broken line), and third (dotted line) pulses were plotted against the amplitude of the Ca2+ current (n = 3 cell pairs).
Fig. 7.
Fig. 7.
Time course of quantal release during a long-lasting depolarization in the presence of 0.5 mm EGTA in the presynaptic patch pipette. A, The presynaptic terminal was depolarized from −80 to +70 mV for 4 msec and repolarized to −10 mV for 50 msec (VPre,top) to elicit a Ca2+ current (IPre, middle). The evoked EPSC (bottom) is shown. The dotted line in the bottom panel indicates the estimated residual current component. B, Release rate estimated from the evoked EPSC is plotted against time. Starting at the time point of 0, the presynaptic terminal was held at −10 mV.C, The cumulative fraction of released vesicles plotted against time. The release rate was integrated after correcting for the effect of refilling of synaptic vesicles to the RRP and was normalized to the total pool size. The data could be fitted with a double exponential, with time constants of 2.01 msec (45%) and 16.64 msec (dotted line).
Fig. 8.
Fig. 8.
Time course of quantal release during long pulses in the presence of 0.05 mm BAPTA in the patch pipette.A, The presynaptic terminal was depolarized from −80 to +70 mV for 4 msec and was held at −10 mV for 20 msec (VPre) to elicit presynaptic Ca2+ current (IPre). The dotted line shows an estimate of the residual current component.B, Release rate plotted against time. Starting at the time point of 0, the presynaptic terminal was held at −10 mV.C, The cumulative fraction of vesicles released is plotted against time. The data could be fitted with double exponentials with time constants of 1.09 msec (68%) and 5.92 msec (dotted line).
Fig. 9.
Fig. 9.
Prepulse experiment for studying the Ca2+ dependence of the slower component.A, Depolarizing pulses (test pulse; 10 msec in duration) of various amplitudes (from −20 to +30 mV) were applied after a fixed prepulse (depolarization to −10 mV for 5 msec). In all protocols, the terminal was finally depolarized to −10 mV for 20 msec, to deplete the RRP. From top, VPre,IPre, EPSC, andrelease rate are shown. B, The same protocol as described in A except that the prepulse was omitted. The same cell pair as in A was used.C, The peak release rate per vesicle during the test pulse in the presence (○) or absence (+) of the prepulse, is plotted against the amplitude of Ca2+ current. The data are from the same cell pair as in A and B. D, The time-to-peak of the release rate per vesicle during the test pulse in the presence (○) or absence (+) of the prepulse is plotted against the amplitude of Ca2+current. The data are from the same cell pair as A andB. Note that the time-to-peak cannot exceed 10 msec, because the pulse duration is 10 msec.
Fig. 10.
Fig. 10.
Prepulse experiment in the presence of 0.5 mm EGTA. A, B, The peak release rate per vesicle (A) and the time-to-peak of the release rate per vesicle (B) during the test pulses (Fig. 9) are plotted against the amplitude of Ca2+ current. Presynaptic patch pipettes contained 0.5 mm EGTA. The data are averages from five cell pairs. Note that the time-to-peak cannot exceed 10 msec, because the pulse duration is 10 msec (the same for D). C,D, The peak release rate per vesicle (C) and the time-to-peak of the release rate per vesicle (D) during test pulses are plotted against the amplitude of Ca2+ current. Presynaptic patch pipettes contained 0.05 mm BAPTA. The data are averages from six cell pairs.
Fig. 11.
Fig. 11.
Release rates observed in the presence of 10 mm extracellular Ca2+. Extracellular Ca2+ was increased to 10 mm to augment the amplitudes of the Ca2+ currents. The presynaptic terminal was depolarized from −80 to +70 mV and repolarized every 10 msec to −10 mV for 4 msec. After repeating this stimulus six times, the terminal was held at −5 mV for 20 msec to deplete the RRP (VPre). Release rates (bottom) were calculated from the evoked EPSC.

Similar articles

Cited by

References

    1. Adler EM, Augustine GJ, Duffy SN, Charlton MP. Alien intracellular calcium chelators attenuate neurotransmitter release at the squid giant synapse. J Neurosci. 1991;11:1496–1507. - PMC - PubMed
    1. Atluri PP, Regehr WG. Determinants of the time course of facilitation at the granule cell to Purkinje cell synapse. J Neurosci. 1996;16:5661–5671. - PMC - PubMed
    1. Auger C, Kondo S, Marty A. Multivesicular release at single functional synaptic sites in cerebellar stellate and basket cells. J Neurosci. 1998;18:4532–4547. - PMC - PubMed
    1. Barbour B, Keller BU, Llano I, Marty A. Prolonged presence of glutamate during excitatory synaptic transmission to cerebellar Purkinje cells. Neuron. 1994;12:1331–1343. - PubMed
    1. Barnes-Davies M, Forsythe ID. Pre- and postsynaptic glutamate receptors at a giant excitatory synapse in rat auditory brainstem slices. J Physiol (Lond) 1995;488:387–406. - PMC - PubMed

Publication types

MeSH terms