. 2001 Feb 1;15(3):267-85.
doi: 10.1101/gad.864201.

E2Fs regulate the expression of genes involved in differentiation, development, proliferation, and apoptosis

Affiliations

E2Fs regulate the expression of genes involved in differentiation, development, proliferation, and apoptosis

H Müller et al. Genes Dev. .

Abstract

The retinoblastoma protein (pRB) and its two relatives, p107 and p130, regulate development and cell proliferation in part by inhibiting the activity of E2F-regulated promoters. We have used high-density oligonucleotide arrays to identify genes in which expression changed in response to activation of E2F1, E2F2, and E2F3. We show that the E2Fs control the expression of several genes that are involved in cell proliferation. We also show that the E2Fs regulate a number of genes involved in apoptosis, differentiation, and development. These results provide possible genetic explanations to the variety of phenotypes observed as a consequence of a deregulated pRB/E2F pathway.


Figures
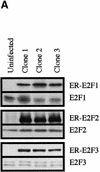
Figure 1
Figure 1
Characterization of cell lines. (A) Expression of estrogen receptor E2F (ER-E2F) fusion proteins. Western blot analysis of whole cell lysates using antibodies specific for E2F1, E2F2, or E2F3 show the expression levels of the ER-E2F fusion proteins as compared to endogenous E2Fs. (B) Nuclear translocation of ER-E2F3 fusion protein. Immunostaining of HA-tagged ER-E2F3 fusion protein was performed using HA-specific antibody 12CA5. The fusion protein was nuclear after the addition of 4-hydroxy tamoxifen (OHT). (C) ER-E2F fusion proteins are transcriptionally active. Fold changes in transcriptional activity were determined by dividing normalized luciferase activity from induced cells (300 nM OHT for 9 hr) by the normalized luciferase activity from uninduced cells. (D) Induction of Cyclin E1 transcription by activated fusion proteins. Semiquantitative RT-PCR of endogenous Cyclin E1 was performed on RNA isolated from cells at the indicated hours after induction of E2F activity by OHT. We used 27 PCR cycles to detect the Cyclin E1 transcript in the ER-E2F-expressing cell lines, whereas 30 PCR cycles were used to detect the transcript in the control (U2OS) samples.
Figure 1
Figure 1
Characterization of cell lines. (A) Expression of estrogen receptor E2F (ER-E2F) fusion proteins. Western blot analysis of whole cell lysates using antibodies specific for E2F1, E2F2, or E2F3 show the expression levels of the ER-E2F fusion proteins as compared to endogenous E2Fs. (B) Nuclear translocation of ER-E2F3 fusion protein. Immunostaining of HA-tagged ER-E2F3 fusion protein was performed using HA-specific antibody 12CA5. The fusion protein was nuclear after the addition of 4-hydroxy tamoxifen (OHT). (C) ER-E2F fusion proteins are transcriptionally active. Fold changes in transcriptional activity were determined by dividing normalized luciferase activity from induced cells (300 nM OHT for 9 hr) by the normalized luciferase activity from uninduced cells. (D) Induction of Cyclin E1 transcription by activated fusion proteins. Semiquantitative RT-PCR of endogenous Cyclin E1 was performed on RNA isolated from cells at the indicated hours after induction of E2F activity by OHT. We used 27 PCR cycles to detect the Cyclin E1 transcript in the ER-E2F-expressing cell lines, whereas 30 PCR cycles were used to detect the transcript in the control (U2OS) samples.
Figure 2
Figure 2
Analysis of gene expression changes. The columns represent numbers of regulated genes (hits) in one (A ), two (B), and three (C) independent measurements. A gene is called regulated when its difference call is induced/moderately induced (I/MI) for up-regulated genes and decreased/moderately decreased (D/MD) for down-regulated genes in all replicates and the fold change (FC) is equal to or beyond the fold-change cutoff in all replicates (FC ≥ cutoff for up-regulated genes or FC ≤ cutoff for down-regulated genes). Checkered bars represent the data. Black bars represent U2OS noise lists (derived from comparing U2OS control chips to each other). White bars represent randomized data lists. See Materials and Methods for details.
Figure 2
Figure 2
Analysis of gene expression changes. The columns represent numbers of regulated genes (hits) in one (A ), two (B), and three (C) independent measurements. A gene is called regulated when its difference call is induced/moderately induced (I/MI) for up-regulated genes and decreased/moderately decreased (D/MD) for down-regulated genes in all replicates and the fold change (FC) is equal to or beyond the fold-change cutoff in all replicates (FC ≥ cutoff for up-regulated genes or FC ≤ cutoff for down-regulated genes). Checkered bars represent the data. Black bars represent U2OS noise lists (derived from comparing U2OS control chips to each other). White bars represent randomized data lists. See Materials and Methods for details.
Figure 3
Figure 3
Verification of microarray data by Northern blotting. (A) Northern blot analysis to verify target gene regulation using 10 μg of total RNA. Cells were harvested after 0 hr, 4 hr, and 8 hr of exposure to 300 nM 4-hydroxy tamoxifen (OHT). (B) Northern blot analysis to verify target gene regulation using 4 μg of poly A+ RNA. Cells were harvested after 0 hr, 4 hr, and 8 hr of exposure to 300 nM OHT.
Figure 4
Figure 4
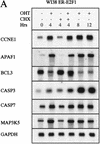
E2F-induced changes in transcript levels are neither confined to transformed cells nor caused by overexpression of E2F fusion proteins. (A) Northern blot analysis of E2F-regulated genes in human diploid WI-38 ERE2F1 cells. 2 μg poly A RNA was loaded. (B) Northern blot analysis of RNA prepared from U2OS pRBΔcdk cells. 15 μg of total RNA was loaded. Hours indicate the time after removal of tetracyclin. Note the increase in the levels of the faster migrating mouse RbΔCDK with time. Blots were probed using a human probe, which likely is the reason that mouse RbΔcdk mRNA produced a much weaker signal than endogenous human RB1.
Figure 4
Figure 4
E2F-induced changes in transcript levels are neither confined to transformed cells nor caused by overexpression of E2F fusion proteins. (A) Northern blot analysis of E2F-regulated genes in human diploid WI-38 ERE2F1 cells. 2 μg poly A RNA was loaded. (B) Northern blot analysis of RNA prepared from U2OS pRBΔcdk cells. 15 μg of total RNA was loaded. Hours indicate the time after removal of tetracyclin. Note the increase in the levels of the faster migrating mouse RbΔCDK with time. Blots were probed using a human probe, which likely is the reason that mouse RbΔcdk mRNA produced a much weaker signal than endogenous human RB1.
Figure 5
Figure 5
Bias analysis. (A) Principle of target gene bias analysis (TGB). TGB determines the significance of a particular class of genes being regulated based on the fraction of these genes being regulated in the total set of detectable genes on the microarrrays. Applied to subsets of genes on a microarray (see panel B), it asks whether the fraction of regulated genes in this subset of genes is equal to the overall fraction of regulated genes. Applied to other microarray experiments (see panel C,D), TGB is sensitive to the relatedness of gene expression patterns. In both cases, significant deviation from the expected value (bias) is hypothesized to imply biological relevance. (B) TGB analysis of functional gene groups. Previously described E2F target genes were included as a positive control. (C) TGB analysis of published screens. Note that TGB is not confined to microarray-based screens. Ras transformation targets were identified by subtractive suppression hybridization (Zuber et al. 2000). (D) Comparison of E2F1, E2F2, and E2F3 expression patterns by TGB. (E) U2OS cells express a random subset of the genes present on the microarray chips. The distribution of unigenes on the chip found in a certain number of libraries is shown. The expected profile (19K exp) is the result of multiplying the number of genes in each category by the fraction of genes expressed in U2OS cells (i.e., the ∼19,000 genes that have been called present in either control or test chips/28,000 unigenes found on the chips). The observed profile (19K obs) represents the genes expressed in U2OS cells. (F) E2F target genes tend to be widely expressed. E2F3 was shown to regulate significantly the expression of 633 genes. The expected profile presents a random expression of these genes, and is found by multiplying the number of genes in each category of genes expressed in U2OS cells (19K obs in panel E) by the fraction of regulated genes (i.e., 633/19,000). The observed profile (633 obs) represents the distribution of the 633 genes regulated by E2F3.
Figure 5
Figure 5
Bias analysis. (A) Principle of target gene bias analysis (TGB). TGB determines the significance of a particular class of genes being regulated based on the fraction of these genes being regulated in the total set of detectable genes on the microarrrays. Applied to subsets of genes on a microarray (see panel B), it asks whether the fraction of regulated genes in this subset of genes is equal to the overall fraction of regulated genes. Applied to other microarray experiments (see panel C,D), TGB is sensitive to the relatedness of gene expression patterns. In both cases, significant deviation from the expected value (bias) is hypothesized to imply biological relevance. (B) TGB analysis of functional gene groups. Previously described E2F target genes were included as a positive control. (C) TGB analysis of published screens. Note that TGB is not confined to microarray-based screens. Ras transformation targets were identified by subtractive suppression hybridization (Zuber et al. 2000). (D) Comparison of E2F1, E2F2, and E2F3 expression patterns by TGB. (E) U2OS cells express a random subset of the genes present on the microarray chips. The distribution of unigenes on the chip found in a certain number of libraries is shown. The expected profile (19K exp) is the result of multiplying the number of genes in each category by the fraction of genes expressed in U2OS cells (i.e., the ∼19,000 genes that have been called present in either control or test chips/28,000 unigenes found on the chips). The observed profile (19K obs) represents the genes expressed in U2OS cells. (F) E2F target genes tend to be widely expressed. E2F3 was shown to regulate significantly the expression of 633 genes. The expected profile presents a random expression of these genes, and is found by multiplying the number of genes in each category of genes expressed in U2OS cells (19K obs in panel E) by the fraction of regulated genes (i.e., 633/19,000). The observed profile (633 obs) represents the distribution of the 633 genes regulated by E2F3.

Similar articles

Cited by

References

    1. Abell ML, Braselton JP, Rafter JA. Statistics with mathematica. Academic Press; 1999.
    1. Ausubel FM, Brent R, Kingston RE, Moore DD, Seidman JG, Smith JA, Struhl K. Current protocols in molecular biology. New York: Greene Publishing Associates & Wiley-Interscience; 1988.
    1. Bi W, Deng JM, Zhang Z, Behringer RR, de Crombrugghe B. Sox9 is required for cartilage formation. Nat Genet. 1999;22:85–89. - PubMed
    1. Blank V, Andrews NC. The Maf transcription factors: Regulators of differentiation. Trends Biochem Sci. 1997;22:437–441. - PubMed
    1. Burke D, Wilkes D, Blundell TL, Malcolm S. Fibroblast growth factor receptors: Lessons from the genes. Trends Biochem Sci. 1998;23:59–62. - PubMed

Publication types

MeSH terms

LinkOut - more resources