

Cellular immune responses and viral diversity in individuals treated during acute and early HIV-1 infection
- PMID: 11148221
- PMCID: PMC2193337
- DOI: 10.1084/jem.193.2.169
Cellular immune responses and viral diversity in individuals treated during acute and early HIV-1 infection
Abstract
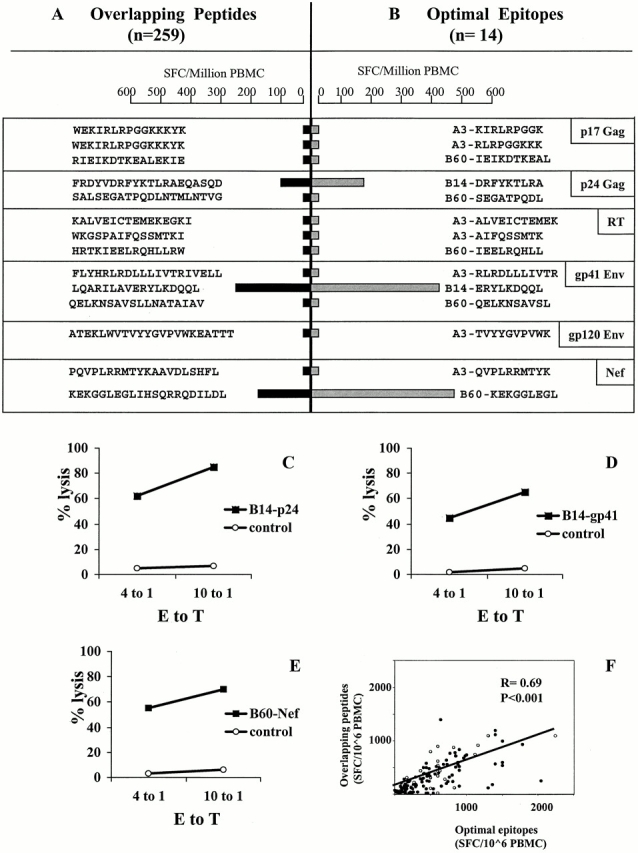
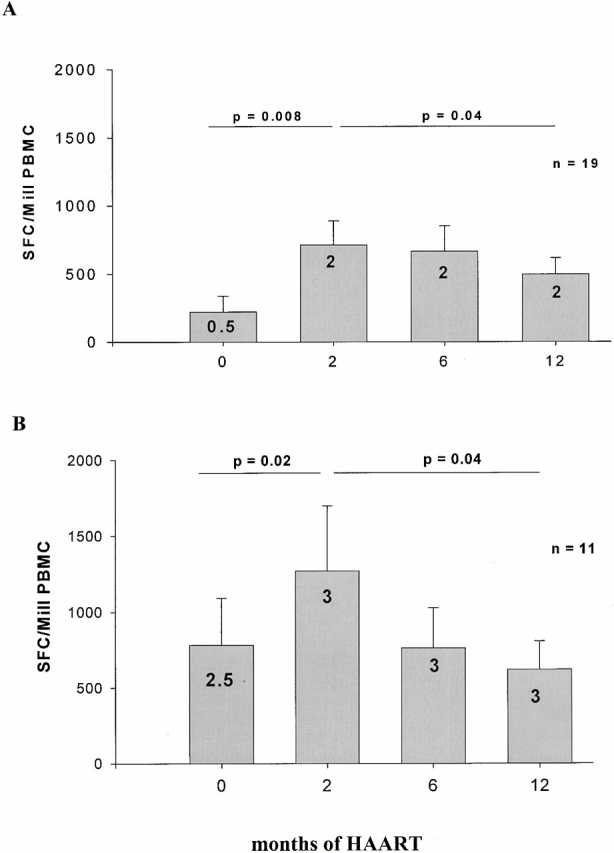
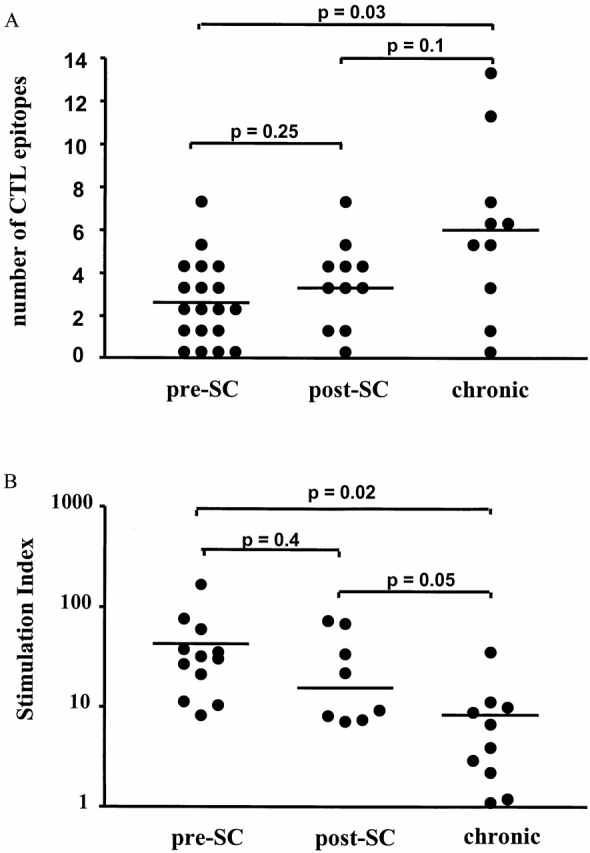
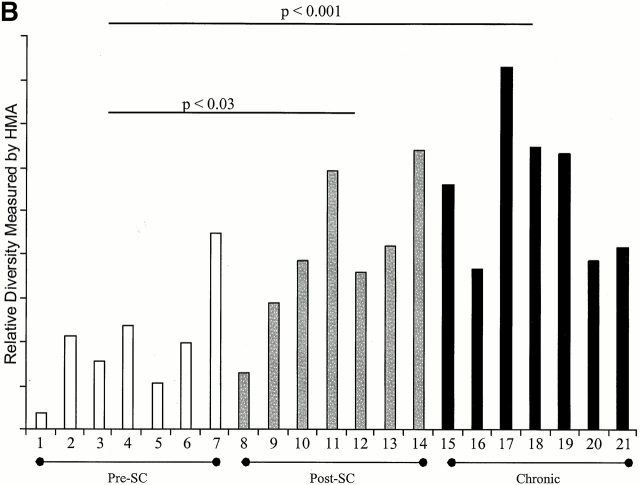
Immune responses induced during the early stages of chronic viral infections are thought to influence disease outcome. Using HIV as a model, we examined virus-specific cytotoxic T lymphocytes (CTLs), T helper cells, and viral genetic diversity in relation to duration of infection and subsequent response to antiviral therapy. Individuals with acute HIV-1 infection treated before seroconversion had weaker CTL responses directed at fewer epitopes than persons who were treated after seroconversion. However, treatment-induced control of viremia was associated with the development of strong T helper cell responses in both groups. After 1 yr of antiviral treatment initiated in acute or early infection, all epitope-specific CTL responses persisted despite undetectable viral loads. The breadth and magnitude of CTL responses remained significantly less in treated acute infection than in treated chronic infection, but viral diversity was also significantly less with immediate therapy. We conclude that early treatment of acute HIV infection leads to a more narrowly directed CTL response, stronger T helper cell responses, and a less diverse virus population. Given the need for T helper cells to maintain effective CTL responses and the ability of virus diversification to accommodate immune escape, we hypothesize that early therapy of primary infection may be beneficial despite induction of less robust CTL responses. These data also provide rationale for therapeutic immunization aimed at broadening CTL responses in treated primary HIV infection.
Figures
Similar articles
-
Cytotoxic T lymphocytes in asymptomatic long-term nonprogressing HIV-1 infection. Breadth and specificity of the response and relation to in vivo viral quasispecies in a person with prolonged infection and low viral load.J Immunol. 1996 Apr 1;156(7):2616-23. J Immunol. 1996. PMID: 8786327
-
Sequential broadening of CTL responses in early HIV-1 infection is associated with viral escape.PLoS One. 2007 Feb 21;2(2):e225. doi: 10.1371/journal.pone.0000225. PLoS One. 2007. PMID: 17311088 Free PMC article.
-
Lack of viral escape and defective in vivo activation of human immunodeficiency virus type 1-specific cytotoxic T lymphocytes in rapidly progressive infection.J Virol. 1999 Jul;73(7):5509-19. doi: 10.1128/JVI.73.7.5509-5519.1999. J Virol. 1999. PMID: 10364299 Free PMC article.
-
Characteristics of the intrahepatic cytotoxic T lymphocyte response in chronic hepatitis C virus infection.Springer Semin Immunopathol. 1997;19(1):69-83. doi: 10.1007/BF00945026. Springer Semin Immunopathol. 1997. PMID: 9266632 Review.
-
Cellular immune response to human immunodeficiency virus.AIDS. 2001 Feb;15 Suppl 2:S16-21. doi: 10.1097/00002030-200102002-00004. AIDS. 2001. PMID: 11424972 Review.
Cited by
-
Mutational escape of CD8+ T cell epitopes: implications for prevention and therapy of persistent hepatitis virus infections.Med Microbiol Immunol. 2015 Feb;204(1):29-38. doi: 10.1007/s00430-014-0372-z. Epub 2014 Dec 24. Med Microbiol Immunol. 2015. PMID: 25537849 Free PMC article. Review.
-
Female genital tract shedding of CXCR4-tropic HIV Type 1 is associated with a majority population of CXCR4-tropic HIV Type 1 in blood and declining CD4(+) cell counts.AIDS Res Hum Retroviruses. 2012 Nov;28(11):1524-32. doi: 10.1089/AID.2012.0004. Epub 2012 Mar 23. AIDS Res Hum Retroviruses. 2012. PMID: 22369497 Free PMC article.
-
Virus-specific CD8+ T-cell responses better define HIV disease progression than HLA genotype.J Virol. 2010 May;84(9):4461-8. doi: 10.1128/JVI.02438-09. Epub 2010 Feb 10. J Virol. 2010. PMID: 20147397 Free PMC article.
-
The majority of currently circulating human immunodeficiency virus type 1 clade B viruses fail to prime cytotoxic T-lymphocyte responses against an otherwise immunodominant HLA-A2-restricted epitope: implications for vaccine design.J Virol. 2005 Apr;79(8):5000-5. doi: 10.1128/JVI.79.8.5000-5005.2005. J Virol. 2005. PMID: 15795285 Free PMC article.
-
Substantial differences in specificity of HIV-specific cytotoxic T cells in acute and chronic HIV infection.J Exp Med. 2001 Jan 15;193(2):181-94. doi: 10.1084/jem.193.2.181. J Exp Med. 2001. PMID: 11148222 Free PMC article.
References
-
- Altfeld M., Rosenberg E.S. The role of CD4+ T helper cells in the cytotoxic T lymphocyte response to HIV-1. Curr. Opin. Immunol. 2000;12:375–380. - PubMed
-
- Brander C., Walker B.D. T lymphocyte responses in HIV-1 infectionimplications for vaccine development. Curr. Opin. Immunol. 1999;11:451–459. - PubMed
-
- Goulder P.J.R. Anti-HIV cellular immunityrecent advances towards vaccine design. AIDS. 1999;13:S121–S136. - PubMed
Publication types
MeSH terms
Substances
Grants and funding
LinkOut - more resources
Full Text Sources
Other Literature Sources
Medical
