Review
. 2000 Dec;64(4):786-820.
doi: 10.1128/MMBR.64.4.786-820.2000.

Origin and evolution of the mitochondrial proteome

Affiliations
Review

Origin and evolution of the mitochondrial proteome

C G Kurland et al. Microbiol Mol Biol Rev. 2000 Dec.

Abstract

The endosymbiotic theory for the origin of mitochondria requires substantial modification. The three identifiable ancestral sources to the proteome of mitochondria are proteins descended from the ancestral alpha-proteobacteria symbiont, proteins with no homology to bacterial orthologs, and diverse proteins with bacterial affinities not derived from alpha-proteobacteria. Random mutations in the form of deletions large and small seem to have eliminated nonessential genes from the endosymbiont-mitochondrial genome lineages. This process, together with the transfer of genes from the endosymbiont-mitochondrial genome to nuclei, has led to a marked reduction in the size of mitochondrial genomes. All proteins of bacterial descent that are encoded by nuclear genes were probably transferred by the same mechanism, involving the disintegration of mitochondria or bacteria by the intracellular membranous vacuoles of cells to release nucleic acid fragments that transform the nuclear genome. This ongoing process has intermittently introduced bacterial genes to nuclear genomes. The genomes of the last common ancestor of all organisms, in particular of mitochondria, encoded cytochrome oxidase homologues. There are no phylogenetic indications either in the mitochondrial proteome or in the nuclear genomes that the initial or subsequent function of the ancestor to the mitochondria was anaerobic. In contrast, there are indications that relatively advanced eukaryotes adapted to anaerobiosis by dismantling their mitochondria and refitting them as hydrogenosomes. Accordingly, a continuous history of aerobic respiration seems to have been the fate of most mitochondrial lineages. The initial phases of this history may have involved aerobic respiration by the symbiont functioning as a scavenger of toxic oxygen. The transition to mitochondria capable of active ATP export to the host cell seems to have required recruitment of eukaryotic ATP transport proteins from the nucleus. The identity of the ancestral host of the alpha-proteobacterial endosymbiont is unclear, but there is no indication that it was an autotroph. There are no indications of a specific alpha-proteobacterial origin to genes for glycolysis. In the absence of data to the contrary, it is assumed that the ancestral host cell was a heterotroph.


Figures

FIG. 1
FIG. 1
Schematic illustration of the relative fraction of mitochondrial proteins with bacterial homologues (black bars) and without bacterial homologues (hatched bars). (Data taken from Karlberg et al. [95].)
FIG. 2
FIG. 2
Schematic illustration of the bioenergetic machineries in mitochondria and Rickettsia. (Modified from reference .) Ac-CoA, acetyl-CoA.
FIG. 3
FIG. 3
(A) Schematic illustration of the pyruvate dehydrogenase complex. (B, C, and D) Phylogenetic reconstructions are based on the combined protein sequences of the α and β subunits of the pyruvate dehydrogenase E1 component (B), the dihydrolipoamide acetyltransferase E2 component (C), and the dihydrolipoamide dehydrogenase E3 component (D) from representative species. Names of species from the α-proteobacteria are shown in boldface and those from mitochondria (mit) are in italics in this and all subsequent figures where bootstrap numbers are indicated above the horizontal lines. The phylogenetic trees were constructed as described by Karlberg et al. (95).
FIG. 3
FIG. 3
(A) Schematic illustration of the pyruvate dehydrogenase complex. (B, C, and D) Phylogenetic reconstructions are based on the combined protein sequences of the α and β subunits of the pyruvate dehydrogenase E1 component (B), the dihydrolipoamide acetyltransferase E2 component (C), and the dihydrolipoamide dehydrogenase E3 component (D) from representative species. Names of species from the α-proteobacteria are shown in boldface and those from mitochondria (mit) are in italics in this and all subsequent figures where bootstrap numbers are indicated above the horizontal lines. The phylogenetic trees were constructed as described by Karlberg et al. (95).
FIG. 4
FIG. 4
(A) Schematic illustration of the TCA cycle. (B, C, and D) Phylogenetic reconstructions based on the succinate dehydrogenase iron sulfur protein (B), malate dehydrogenase (C), and aconitase (D) from representative species. The phylogenetic trees were constructed as described by Karlberg et al. (95). gly,glycosome; per, peroxisome; cyt, cytosol; chl1 and chl2, chloroplast 1 and 2, respectively; mit, mitochondrion.
FIG. 4
FIG. 4
(A) Schematic illustration of the TCA cycle. (B, C, and D) Phylogenetic reconstructions based on the succinate dehydrogenase iron sulfur protein (B), malate dehydrogenase (C), and aconitase (D) from representative species. The phylogenetic trees were constructed as described by Karlberg et al. (95). gly,glycosome; per, peroxisome; cyt, cytosol; chl1 and chl2, chloroplast 1 and 2, respectively; mit, mitochondrion.
FIG. 5
FIG. 5
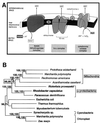
(A) Schematic illustration of the respiratory chain complex. (B and C). Phylogenetic reconstructions based on the combined protein sequences of NADH dehydrogenase I chains A, J, K, L, M, and N (B) and the combined protein sequences of cytochrome b and cytochrome c oxidase subunit I (C) from representative species. The phylogenetic trees were constructed as described by Karlberg et al. (95). (B) The arrow indicates the bootstrap value at that node.
FIG. 5
FIG. 5
(A) Schematic illustration of the respiratory chain complex. (B and C). Phylogenetic reconstructions based on the combined protein sequences of NADH dehydrogenase I chains A, J, K, L, M, and N (B) and the combined protein sequences of cytochrome b and cytochrome c oxidase subunit I (C) from representative species. The phylogenetic trees were constructed as described by Karlberg et al. (95). (B) The arrow indicates the bootstrap value at that node.
FIG. 6
FIG. 6
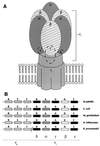
(A) Schematic representation of the ATP synthase complex and (B) organization of the ATP synthase genes. (C) Phylogenetic reconstructions based on the combined protein sequences of the α and γ subunits of the ATP synthase complex from representative species. The phylogenetic trees were constructed as described by Karlberg et al. (95). Chl/Nuc refers to chloroplast/nucleus.
FIG. 6
FIG. 6
(A) Schematic representation of the ATP synthase complex and (B) organization of the ATP synthase genes. (C) Phylogenetic reconstructions based on the combined protein sequences of the α and γ subunits of the ATP synthase complex from representative species. The phylogenetic trees were constructed as described by Karlberg et al. (95). Chl/Nuc refers to chloroplast/nucleus.
FIG. 7
FIG. 7
Schematic illustration of the import of cytosolic components for the gene expression systems in mitochondria and Rickettsia. AA, amino acid; RNA-P, RNA polymerase.
FIG. 8
FIG. 8
Phylogenetic reconstructions based on rRNA sequences from Zea mays mitochondria and representative α-proteobacterial species. The tree is drawn according to Olsen et al. (141).
FIG. 9
FIG. 9
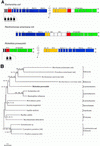
(A) Schematic illustration of the organization of the ribosomal protein genes in Escherichia coli, Rickettsia prowazekii, and the mitochondrial (mit) genome of Reclinomonas americana. (B) Phylogenetic reconstructions based on the combined protein sequences of the ribosomal proteins S2, S7, S10, S12, S13, S14, S19, L5, L6, and L16 from representative species. The phylogenetic trees were constructed as described by Karlberg et al. (95).
FIG. 10
FIG. 10
Schematic illustration of the evolution of aminoacyl-tRNA synthetases. The phylogenetic trees are based on glutamyl-tRNA synthetases (A), arginyl-tRNA synthetases (B), and histidyl-tRNA synthetases (C) from representative species. The phylogenetic trees were constructed as described by Karlberg et al. (95).
FIG. 10
FIG. 10
Schematic illustration of the evolution of aminoacyl-tRNA synthetases. The phylogenetic trees are based on glutamyl-tRNA synthetases (A), arginyl-tRNA synthetases (B), and histidyl-tRNA synthetases (C) from representative species. The phylogenetic trees were constructed as described by Karlberg et al. (95).
FIG. 11
FIG. 11
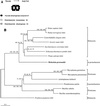
Phylogenetic reconstructions based on heat shock protein HSP60 from representative species. The phylogenetic trees were constructed as described by Karlberg et al. (95). hyd, hydrogenosome clade; mit, mitochondrion.
FIG. 12
FIG. 12
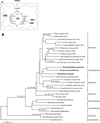
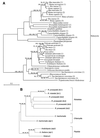
Illustration of mitochondrial regulatory and transport proteins of bacterial origin. Phylogenetic reconstructions are based on the regulatory protein MSS1 (A) and the ABC transporter protein ATM1 (B) from representative species. The phylogenetic trees were constructed as described by Karlberg et al. (95). mit, mitochondrion; chl, chloroplast; vac, vacuole.
FIG. 12
FIG. 12
Illustration of mitochondrial regulatory and transport proteins of bacterial origin. Phylogenetic reconstructions are based on the regulatory protein MSS1 (A) and the ABC transporter protein ATM1 (B) from representative species. The phylogenetic trees were constructed as described by Karlberg et al. (95). mit, mitochondrion; chl, chloroplast; vac, vacuole.
FIG. 13
FIG. 13
Illustration of mitochondrial transport proteins of eukaryotic origin. Phylogenetic reconstructions are based on ATP/ADP translocases from mitochondria (A) and bacteria (B). The phylogenetic trees were constructed as described by Karlberg et al. (95).

Similar articles

Cited by

References

    1. Adams K L, Song K, Roessler P G, Nugent J M, Doyle J L, Doyle J J, Palmer J D. Intracellular gene transfer in action: dual transcription and multiple silencings of nuclear and mitochondrial cox2 genes in legumes. Proc Natl Acad Sci USA. 1999;96:13863–13868. - PMC - PubMed
    1. Akhmonova A, Voncken F G J, Harhangi H, Hosea K M, Vogels G D, Hackstein J H P. Cytosolic enzymes with a mitochondrial ancestry from the anaerobic chytrid Piromyces sp. E2. Mol Microbiol. 1998;30:1017–1027. - PubMed
    1. Akhmanova A, Voncken F G J, Hosea K M, Harhangi H, Keltjens J T, op den Camp H, Vogels G D, Hackstein J H P. A hydrogenosome with pyruvate formate-lyase: anaerobic chytrid fungi use an alternative route for pyruvate catabolism. Mol Microbiol. 1999;32:103–114. - PubMed
    1. Akhmanova A, Voncken F, van Alen T, van Hoek A, Boxma B, Vogels G, Veenhuis M, Hackstein J H P. A hydrogenosome with a genome. Nature (London) 1998;396:527–528. - PubMed
    1. Allen J. Control of gene expression by redox potential and the requirement for chloroplast and mitochondria genomes. J Theor Biol. 1993;165:609–631. - PubMed

Publication types

LinkOut - more resources