Genome-wide study of aging and oxidative stress response in Drosophila melanogaster
- PMID: 11095759
- PMCID: PMC17643
- DOI: 10.1073/pnas.260496697
Genome-wide study of aging and oxidative stress response in Drosophila melanogaster
Abstract
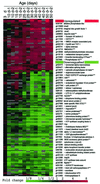
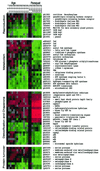
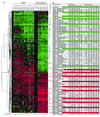
Aging is a universal but poorly understood biological process. Free radicals accumulate with age and have been proposed to be a major cause of aging. We measured genome-wide changes in transcript levels as a function of age in Drosophila melanogaster and compared these changes with those caused by paraquat, a free-radical generator. A number of genes exhibited changes in transcript levels with both age and paraquat treatment. We also found genes whose transcript levels changed with age but not with paraquat treatment. This study suggests that free radicals play an important role in regulating transcript levels in aging but that they are not the only factors. This genome-wide survey also identifies candidates for molecular markers of aging.
Figures


Similar articles
-
Genome-wide transcript profiles in aging and calorically restricted Drosophila melanogaster.Curr Biol. 2002 Apr 30;12(9):712-23. doi: 10.1016/s0960-9822(02)00808-4. Curr Biol. 2002. PMID: 12007414
-
Slowed aging during reproductive dormancy is reflected in genome-wide transcriptome changes in Drosophila melanogaster.BMC Genomics. 2016 Jan 13;17:50. doi: 10.1186/s12864-016-2383-1. BMC Genomics. 2016. PMID: 26758761 Free PMC article.
-
Genome-wide analysis of low-dose irradiated male Drosophila melanogaster with extended longevity.Biogerontology. 2011 Apr;12(2):93-107. doi: 10.1007/s10522-010-9295-2. Epub 2010 Jul 9. Biogerontology. 2011. PMID: 20617381
-
Oxidative stress, aging and longevity in Drosophila melanogaster.FEBS Lett. 2001 Jun 8;498(2-3):183-6. doi: 10.1016/s0014-5793(01)02457-7. FEBS Lett. 2001. PMID: 11412853 Review.
-
Circadian regulation of metabolism and healthspan in Drosophila.Free Radic Biol Med. 2018 May 1;119:62-68. doi: 10.1016/j.freeradbiomed.2017.12.025. Epub 2017 Dec 19. Free Radic Biol Med. 2018. PMID: 29277395 Free PMC article. Review.
Cited by
-
Reproductive activation in honeybee (Apis mellifera) workers protects against abiotic and biotic stress.Philos Trans R Soc Lond B Biol Sci. 2021 Apr 26;376(1823):20190737. doi: 10.1098/rstb.2019.0737. Epub 2021 Mar 8. Philos Trans R Soc Lond B Biol Sci. 2021. PMID: 33678021 Free PMC article.
-
Genetic, Environmental, and Stochastic Components of Lifespan Variability: The Drosophila Paradigm.Int J Mol Sci. 2024 Apr 19;25(8):4482. doi: 10.3390/ijms25084482. Int J Mol Sci. 2024. PMID: 38674068 Free PMC article. Review.
-
Aging field collected Aedes aegypti to determine their capacity for dengue transmission in the southwestern United States.PLoS One. 2012;7(10):e46946. doi: 10.1371/journal.pone.0046946. Epub 2012 Oct 12. PLoS One. 2012. PMID: 23077536 Free PMC article.
-
Genetic approaches to study aging in Drosophila melanogaster.Age (Dordr). 2005 Sep;27(3):165-82. doi: 10.1007/s11357-005-2919-9. Epub 2005 Dec 31. Age (Dordr). 2005. PMID: 23598651 Free PMC article.
-
Honey bee (Apis mellifera) drones survive oxidative stress due to increased tolerance instead of avoidance or repair of oxidative damage.Exp Gerontol. 2016 Oct;83:15-21. doi: 10.1016/j.exger.2016.07.003. Epub 2016 Jul 12. Exp Gerontol. 2016. PMID: 27422326 Free PMC article.
References
-
- Johnson F B, Sinclair D A, Guarente L. Cell. 1999;96:291–302. - PubMed
-
- Orr W C, Sohal R S. Science. 1994;263:1128–1130. - PubMed
-
- Lin Y J, Seroude L, Benzer S. Science. 1998;282:943–946. - PubMed
-
- Parkes T L, Elia A J, Dickinson D, Hilliker A J, Phillips J P, Boulianne G L. Nat Genet. 1998;19:171–174. - PubMed
-
- Migliaccio E, Giorgio M, Mele S, Pelicci G, Reboldi P, Pandolfi P P, Lanfrancone L, Pelicci P G. Nature (London) 1999;402:309–313. - PubMed
Publication types
MeSH terms
Substances
LinkOut - more resources
Full Text Sources
Other Literature Sources
Medical
Molecular Biology Databases

